https://doi.org/10.22267/rtend.26272.296
Finance
Comparative analysis between traditional momentum and machine learning (random forest): evidence from the S&P 500 (2000-2024)
Análisis comparativo entre momentum tradicional y machine learning (Random Forest): evidencia para el S&P 500 (2000-2024)
Análise comparativa entre momentum tradicional e machine learning (random forest): evidências do S&P 500 (2000-2024)
By: Carlos Palomino Selem 1; Ruth Milagros Delgado Yana2
1Master in Quantitative Finance, Universidad Alcalá. Profesor Ordinario, Associate Category, Facultad de Ciencias Económicas, Universidad Nacional Mayor de San Marcos, Perú. ORCID: 0000-0001-9582-2442. E-mail: cpalominos@unmsm.edu.pe, Lima - Perú.
2 Master in Banking and Financial Law, Pontificia Universidad Católica del Perú (PUCP). Adjunct professor, adscrito a la Unidad de Post Grado, Universidad ESAN, Perú. ORCID: 0009-0007-8677-3213. E-mail: rdelgado@esan.edu.pe, Lima – Perú.
Received: October 31, 2025 Accepted: June 6, 2026
DOI: https://doi.org/10.22267/rtend.26272.296
How to cite this article: Palomino S., C. & Delgado, R. (2026). Comparative analysis between traditional momentum and machine learning (random forest): evidence from the S&P 500 (2000-2024). Tendencias, 27(2), 32-61. https://doi.org/10.22267/rtend.26272.296

Abstract
Introduction: This study examines the validity and persistence of the momentum effect in the S&P 500 index (2000–2024), a developed equity market with high informational efficiency. It analyzes whether the empirical evidence supports the continuity of momentum across different time horizons. Objective: To compare the performance of traditional momentum (TM) with a supervised learning model based on Random Forest (RF), assessing predictive ability, risk-adjusted performance, and out-of-sample stability. Methodology: Long–short TM strategies were implemented for horizons of 1, 3, 6, and 12 months, and the RF model was trained using equivalent cumulative returns. Out-of-sample validation was applied through an expanding window, homogeneous backtesting, and temporal stability tests. Results: TM showed limited performance over short horizons and greater consistency over long horizons. RF exhibited greater predictive ability and profitability, especially over long horizons, although with episodes of volatility and overfitting risk. Discussion: Machine learning models capture nonlinear patterns not identifiable by traditional methods, but depend on market conditions and show lower temporal stability, evidencing a trade-off between profitability and robustness. Conclusions: The findings confirm the persistence of momentum and highlight the value of machine learning in financial prediction, underscoring the importance of rigorous validation and risk control.
Keywords: machine learning; investments; capital markets; economic models; momentum; Random Forest; risk; portfolio selection.
JEL: C45; C53; C58; G11; G12; G14.
Resumen
Introducción: Este estudio examina la validez y persistencia del efecto momentum en el índice S&P 500 (2000–2024), un mercado accionario desarrollado y con alta eficiencia informacional. Se analiza si la evidencia empírica respalda la continuidad del momentum en distintos horizontes temporales. Objetivo: Comparar el desempeño del momentum tradicional (MT) con un modelo de aprendizaje supervisado basado en Random Forest (RF), evaluando capacidad predictiva, rendimiento ajustado por riesgo y estabilidad fuera de muestra. Metodología: Se implementaron estrategias long–short de MT para horizontes de 1, 3, 6 y 12 meses, y el modelo RF fue entrenado con retornos acumulados equivalentes. Se aplicó validación fuera de muestra mediante ventana expansiva, backtesting homogéneo y pruebas de estabilidad temporal. Resultados: El MT mostró desempeño limitado en horizontes cortos y mayor consistencia en horizontes largos. RF presentó mayor capacidad predictiva y rentabilidad, especialmente en horizontes largos, aunque con episodios de volatilidad y riesgo de sobreajuste. Discusión: Los modelos de aprendizaje automático capturan patrones no lineales no identificables por métodos tradicionales, pero dependen de condiciones de mercado y presentan menor estabilidad temporal, evidenciando un trade-off entre rentabilidad y robustez. Conclusiones: Los hallazgos confirman la persistencia del momentum y destacan el valor del machine learning en predicción financiera, subrayando la importancia de validación rigurosa y control de riesgo.
Palabras clave: aprendizaje automático; inversiones; mercados de capitales; modelos económicos; momentum; Random Forest; riesgo; selección de portafolios.
JEL: C45; C53; C58; G11; G12; G14.
Resumo
Introdução: Este estudo analisa a validade e a persistência do efeito momentum no índice S&P 500 (2000–2024), um mercado bolsista desenvolvido e com elevada eficiência informacional. Analisa-se se a evidência empírica corrobora a continuidade do momentum em diferentes horizontes temporais. Objetivo: Comparar o desempenho do momentum tradicional (MT) com um modelo de aprendizagem supervisionada baseado em Random Forest (RF), avaliando a capacidade preditiva, o rendimento ajustado ao risco e a estabilidade fora da amostra. Metodologia: Foram implementadas estratégias long–short de MT para horizontes de 1, 3, 6 e 12 meses, e o modelo RF foi treinado com retornos acumulados equivalentes. A validação fora da amostra foi aplicada através de janela expansiva, backtesting homogéneo e testes de estabilidade temporal. Resultados: O MT apresentou um desempenho limitado em horizontes curtos e maior consistência em horizontes longos. O RF apresentou maior capacidade preditiva e rentabilidade, especialmente em horizontes longos, embora com episódios de volatilidade e risco de sobreajuste. Discussão: Os modelos de aprendizagem automática captam padrões não lineares não identificáveis por métodos tradicionais, mas dependem das condições de mercado e apresentam menor estabilidade temporal, evidenciando um compromisso entre rentabilidade e robustez. Conclusões: Os resultados confirmam a persistência do momentum e destacam o valor da aprendizagem automática na previsão financeira, sublinhando a importância de uma validação rigorosa e do controlo de risco.
Palavras-chave: aprendizagem automática; investimentos; mercados de capitais; modelos económicos; momentum; Random Forest; risco; seleção de carteiras.
JEL: C45; C53; C58; G11; G12; G14.
Introduction
The Efficient Market Hypothesis (EMH), proposed by Fama (1970), holds that asset prices immediately reflect all available information, which would limit the possibility of systematically obtaining abnormal returns. The growing incorporation of advanced technologies such as artificial intelligence (AI) and high-frequency trading (HFT) has reinforced this argument by accelerating the incorporation of information into prices and reducing arbitrage opportunities. Despite this, numerous studies have documented persistent anomalies that challenge the efficiency paradigm, including the momentum effect, initially identified by Jegadeesh and Titman (1993) and later expanded by contributions such as those of Carhart (1997), Novy-Marx (2012), Fama and French (1996), and Asness et al. (2013). This anomaly, characterized by the short-term continuity of past returns, has been observed across different markets (Rouwenhorst, 1998), asset classes, and historical periods (Jegadeesh & Titman, 2001).
Explanations regarding the origin of momentum remain a subject of debate. One line of research links it to behavioral biases such as overconfidence, the disposition effect, and confirmation bias according to Barberis et al. (1998), along with behavioral evidence presented by Shiller (2003), while Lo (2004) attributes it to unobserved risk factors or market-specific frictions. More recently, Bandarchuk and Hilscher (2013) have shown that the profitability attributed to momentum may be concentrated in assets with extreme past returns, suggesting that part of the effect responds to specific characteristics that traditional models do not fully capture. In parallel, advances in big data and machine learning methods have revived interest in studying return anomalies. Models such as Random Forest, XGBoost, and neural networks allow for the detection of nonlinear patterns, complex interactions, and predictive signals in large volumes of data, overcoming the limitations of classical linear models according to Gu et al. (2020) and Krauss et al. (2017).
Despite advances in the literature, important questions persist regarding the continued relevance of the momentum effect in highly automated markets and the ability of machine learning models to generate consistent improvements in economic terms. In particular, recent literature has emphasized the difference between statistical predictive ability and economically exploitable profitability, as well as the risks of overfitting and the need for rigorous out-of-sample validation (Gu et al., 2020). However, there is still limited evidence on whether these approaches consistently improve the performance of classic momentum strategies in real investment contexts.
Within this framework, the present study analyzes whether supervised learning models are able to predict monthly returns for stocks belonging to the S&P 500 index. The initial universe considers companies that have been part of the index during the 2000–2024 period. From this set, the final sample consists of 352 companies that exhibit continuous trading and complete price data availability throughout the entire analysis period.
The inclusion criterion is based on the availability of complete time series without interruptions, which ensures consistency in the construction of variables and in the implementation of the strategies. Consequently, companies with incomplete data or discontinuities in trading that prevent series continuity are excluded.
However, this procedure may introduce survivorship bias, by concentrating on companies with greater temporal stability and excluding those that ceased trading or left the index. This bias is not explicitly corrected in the present study, so the results should be interpreted as representative of a more stable subset of the S&P 500 universe.
The central objective is to assess whether, in a market that should operate under conditions of efficiency, non-parametric methods are capable of identifying sufficient predictive signals to construct portfolios with superior risk-adjusted returns, measured through Sharpe ratio, maximum drawdown, and Fama-French-Carhart alpha. It also analyzes whether such strategies can generate abnormal returns consistently.
In this context, the present study makes three main contributions. First, it provides updated empirical evidence on the continued relevance of the momentum effect in a developed and highly automated market such as the S&P 500 during the 2000–2024 period, assessing its behavior across different time horizons. Second, it introduces a methodological approach based on supervised learning through Random Forest, which captures nonlinear relationships and compares its performance against traditional strategies under a rigorous out-of-sample validation scheme. Third, it analyzes the economic applicability of these strategies, evaluating not only their profitability but also their stability, risk, and feasibility of implementation in real investment contexts.
Revisión de literatura
The study of momentum in financial capital markets has its most influential empirical origin in the work of Jegadeesh and Titman (1993) in their article “Returns to buying winners and selling losers: Implications for stock market efficiency.” The strategy consisted of buying stocks with high past returns and selling stocks with low returns, generating positive returns over horizons of 3 to 12 months. This finding challenged the Efficient Market Hypothesis (EMH) in its weak and semi-strong forms (Fama, 1970). Subsequently, the same authors confirmed that the momentum effect had persisted for decades and could not be fully explained by traditional risk factors (Jegadeesh & Titman, 2001).
In empirical terms, evidence has shown that momentum is a global phenomenon. Rouwenhorst (1998) documented it in European markets, while Asness et al. (2013) demonstrated its presence across multiple asset classes such as bonds, currencies, and commodities, highlighting its cross-sectional nature. Chui et al. (2010), in turn, showed that momentum is weaker in markets with greater participation of individual investors, suggesting that market structure influences the magnitude of the effect.
In recent years, momentum analysis has extended toward the use of machine learning methods, as demonstrated by Bui et al. (2023), extending momentum analysis with machine learning, in line with Gu et al. (2020), who compared traditional momentum strategies and machine learning models in the Taiwanese market. Their results indicate that institutional characteristics condition the stability of momentum and that supervised models capture complex nonlinear relationships.
The EMH, in its original formulation, holds that prices reflect all available information (Fama, 1970); however, momentum remains one of the most robust anomalies. Studies by Carhart (1997) and Novy-Marx (2012) showed that the effect retains its explanatory power even after incorporating multifactor models. Along these lines, Yao et al. (2022) extended classic approaches through deep neural networks, integrating traditional factors and nonlinearly generated variables. Their results indicate that these architectures capture complex interactions and improve predictive ability in dynamic contexts.
Nevertheless, these advances also raise questions about whether such improvements in predictive ability effectively translate into economically exploitable investment strategies, especially in the presence of transaction costs, regime changes, and limitations associated with out-of-sample validation. In this sense, recent literature emphasizes that the predictive superiority of machine learning models does not necessarily guarantee improvements in risk-adjusted profitability or out-of-sample robustness (Bagnara, 2022; Gu et al., 2020).
Explanations of momentum fall into two main perspectives. The first is the behavioral hypothesis, which attributes the phenomenon to slow or excessive investor reactions to new information (Barberis et al., 1998; Hong & Stein, 1999; Shiller, 2003). The second is the risk hypothesis, according to which momentum represents a premium for risks not captured by traditional models (Conrad & Kaul, 1998; Lo, 2004). More recently, Bandarchuk and Hilscher (2013) showed that, when controlling for extreme past returns, much of the momentum profitability disappears, suggesting that the phenomenon may be concentrated in assets with atypical behavior not incorporated into standard risk models. These results suggest that momentum is not a homogeneous phenomenon, but rather that its profitability may depend on specific asset characteristics and market dynamics. In this sense, the evidence points to more flexible approaches, capable of capturing heterogeneity and nonlinear relationships, potentially offering a better representation of the phenomenon (Gu et al., 2020).
In a complementary manner, recent studies (Bagnara, 2022; Zhang, 2022) suggest that nonlinear models and deep learning techniques allow for more precise capture of risk dynamics in markets with frictions. Likewise, Daniel and Moskowitz (2016) demonstrated that momentum strategies are vulnerable to so-called momentum crashes, abrupt declines typical of periods of high volatility or market reversal. This risk has driven the development of conditional approaches and the use of machine learning to identify structural changes and reduce exposure in adverse regimes (Chin et al., 2022).
Advances in machine learning methods have substantially expanded the available tools for studying return anomalies. Models such as Random Forest, XGBoost, Support Vector Machines, and neural networks allow for modeling nonlinear relationships, capturing complex interactions between variables, and processing large volumes of financial information.
Among machine learning models, Random Forest presents relevant advantages in quantitative finance due to its ability to model nonlinear relationships, reduce variance through aggregation processes, and partially control overfitting through the combination of multiple decision trees. These characteristics have favored its growing use in financial prediction and cross-sectional asset classification problems.
Gu et al. (2020) showed that these machine learning methods outperform traditional regressions in cross-sectional prediction. Similarly, Fieberg et al. (2023) found significant improvements in predicting European stock returns through machine learning models. Krauss et al. (2017) demonstrated that deep learning can generate profitable strategies even after transaction costs, and studies such as Beckmeyer and Wiedemann (2025), Goyal et al. (2025), Mattusch (2024), and Ye et al. (2024) highlight that the use of advanced AI, including generative AI, is transforming the financial asset pricing model by introducing adaptive learning components.
Finally, a key concern in quantitative finance is overfitting. Models can capture noise rather than genuine patterns, generating artificially outstanding backtesting results but with limited out-of-sample generalization ability (Liao et al., 2025; López, 2018). For this reason, the literature emphasizes the need for rigorous validation schemes, including cross-validation for time series, walk-forward analysis, and regularization techniques, in order to ensure statistical robustness and the generalization ability of models. From this perspective, the value of machine learning in finance does not depend solely on its algorithmic sophistication, but on the solidity of its risk control and validation mechanisms.
In this context, there is a need to assess whether the incorporation of machine learning techniques consistently improves the performance of traditional momentum strategies, not only in terms of predictive ability, but also in terms of risk-adjusted profitability and out-of-sample robustness.
In summary, the literature has robustly documented the existence of the momentum effect across different markets and asset classes, as well as the potential of machine learning models to improve predictive ability in financial contexts. However, important questions remain regarding whether these improvements translate into economically significant and out-of-sample robust results, especially in developed markets characterized by high levels of efficiency and automation. In this sense, the present study contributes to this discussion by comparatively assessing the performance of traditional momentum and a Random Forest-based model in the S&P 500, incorporating a rigorous validation approach and analyzing both the profitability and the stability of the strategies.
Methodology
The study is based on a sample of 352 stocks corresponding to the S&P 500 index universe that exhibit continuous trading throughout the entire analysis period. Daily closing prices adjusted for dividends and corporate events (splits), obtained from Bloomberg, are used. Based on this information, monthly returns are constructed for the empirical analysis.
The continuous trading restriction responds to the need for homogeneous and complete series throughout the analysis period, which is especially relevant for estimating machine learning models under temporal training schemes. However, this criterion may introduce survivorship bias, so the results should be interpreted considering this limitation.
The methodological objective is to compare the performance of two cross-sectional momentum approaches:
- A traditional strategy based on ranking past returns over horizons of 1, 3, 6, and 12 months.
- A supervised learning approach based on the Random Forest algorithm, aimed at predicting future returns and constructing portfolios.
Traditional (cross-sectional) Momentum with Multiple Horizons:
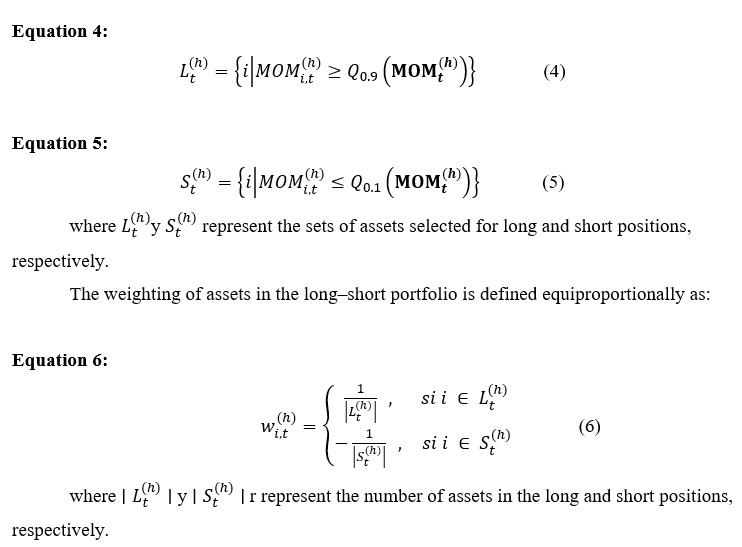
For each horizon h ∈ {1, 3, 6, and 12}, a momentum signal is constructed based on cumulative past returns, excluding the most recent month in order to avoid look-ahead biases. In each period, assets are ranked according to this signal and long–short portfolios are formed by selecting the top decile (assets with the highest past returns) and the bottom decile (assets with the lowest returns).
The resulting portfolio maintains a net long–short position with monthly rebalancing, regardless of the lookback horizon. This approach follows the classic methodology of Jegadeesh and Titman (1993; 2001).
The mathematical formulation of the momentum signal and portfolio construction are presented below.
Equation 1:
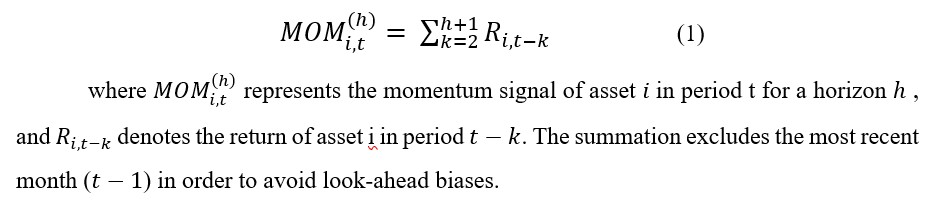
In each period t and for each horizon h, the vector of momentum signals for the set of assets is defined as:
Equation 2:

From this vector, the quantiles of the cross-sectional distribution are determined.
Equation 3:

The sets of assets in long and short positions are defined as:
The return of the long–short portfolio is defined as:
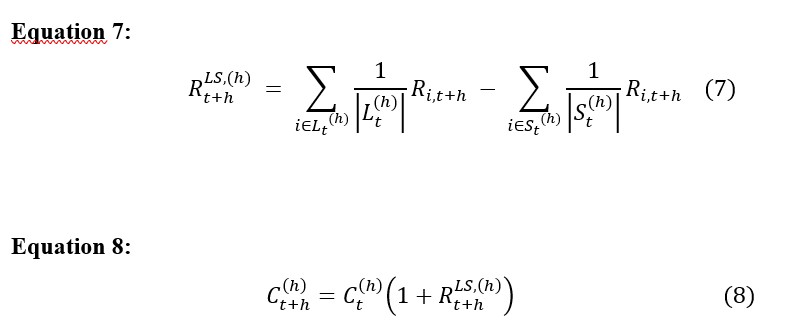
where C_((h)^(t+h) ) represents the portfolio capital at horizon h, which evolves from the capital at t according to the long–short portfolio returns, with initial condition C_((h)^0 )=1.
Momentum with Supervised Learning Using the Random Forest Model
The Random Forest model is trained using cumulative returns across different horizons (1, 3, 6, and 12 months), excluding the most recent month in order to avoid look-ahead biases. Estimation is carried out under an expanding window scheme, in which the model is dynamically adjusted using only the information available up to each period.
The model is implemented as a classifier based on ensembles of decision trees, using 200 trees (n_estimators = 200) and a restricted maximum depth (max_depth = 5), with the objective of controlling overfitting and improving generalization ability. In each period, the model is retrained using all historical information available up to that point, ensuring a strictly out-of-sample environment.
In operational terms, the model uses the Gini impurity criterion for node splitting and employs bootstrap sampling in tree construction, which contributes to reducing variance and improving the stability of predictions. Hyperparameter selection is performed conservatively, fixing the number of trees and the maximum depth with the objective of avoiding overfitting, without implementing exhaustive optimization processes, in line with approaches that prioritize out-of-sample robustness.
The objective of the model is to predict the probability that an asset belongs to the top decile of the cross-sectional return distribution in the following period. Based on these probabilities, long–short portfolios are constructed through cross-sectional ranking of assets, selecting those with the highest and lowest estimated probability, respectively. Rebalancing is performed monthly, maintaining consistency with the traditional momentum strategy.
Since the target variable is defined as belonging to the top return decile, the problem presents a class imbalance. This aspect is addressed implicitly through the use of estimated probabilities and cross-sectional ranking, rather than explicit rebalancing techniques, which allows the economic coherence of the strategy to be maintained.
The training and validation scheme follows an expanding window approach, in which the model is trained in each period using all information available up to that point and evaluated in the following period. The model is trained using a minimum of 24 months of historical information before generating the first predictions, in order to ensure stability in the initial estimation. This procedure ensures strictly out-of-sample validation and avoids look-ahead biases, being equivalent to a walk-forward scheme widely used in quantitative finance.
This methodological approach is supported by recent evidence highlighting the ability of machine learning algorithms to capture nonlinear relationships and complex patterns in financial markets (Gu et al., 2020), as well as by the growing adoption of Random Forest-based models in the quantitative analysis of asset prices (Healy et al., 2024).
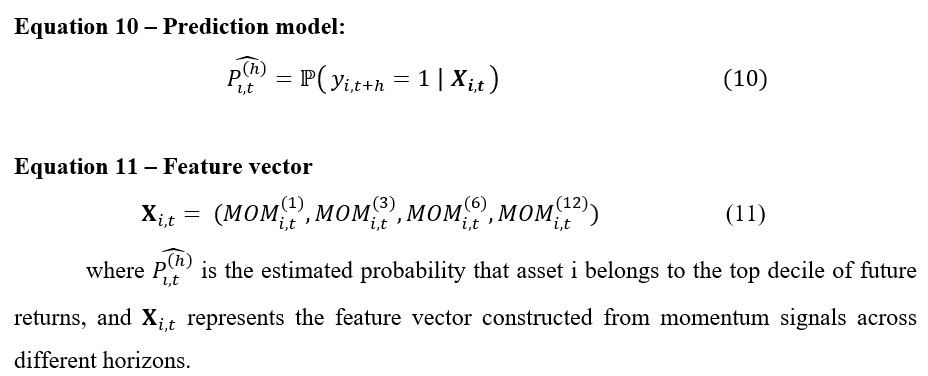
The general momentum model with Random Forest
The Random Forest model uses the previously defined momentum signals as explanatory variables. The prediction is formulated as a binary classification problem.
 where y_(i,t+h) is a binary variable that takes the value 1 if the return of asset i in period t+h belongs to the top decile of the cross-sectional return distribution, and 0 otherwise.
Portfolio Construction (cross-sectional)
In each period  , assets are ranked based on the estimated probabilities
  , defining the sets of long and short positions as:

The weighting of assets is performed uniformly, following the same scheme used in the traditional momentum strategy. Consequently, the return of the long–short portfolio is defined as:
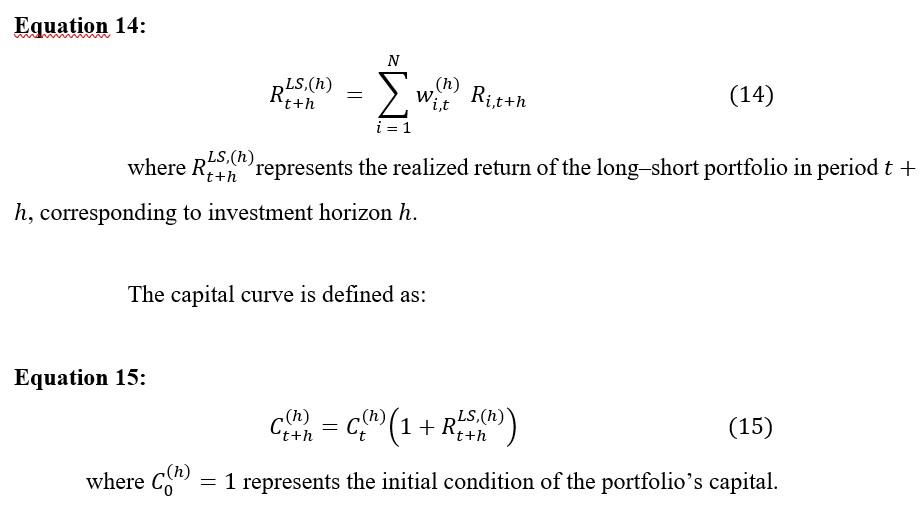
Backtesting and evaluation metrics
Both approaches are evaluated under a homogeneous backtesting scheme, in order to ensure the comparability of results. In particular, monthly portfolio rebalancing is considered, with equal weighting of assets on each side (long and short). Results are presented in gross terms, without explicitly incorporating transaction costs.
Performance evaluation is carried out through a set of financial metrics widely used in the literature, including annualized return, the Sharpe ratio, maximum drawdown, hit rate, and alpha adjusted according to the Fama–French–Carhart model.
This methodological design allows for analyzing whether the incorporation of machine learning algorithms, particularly Random Forest, improves risk-adjusted performance compared to the traditional momentum approach, as well as assessing the economic significance of such differences.
Results
The results charts include gray bands identifying the main financial crisis episodes between 2000 and 2024, allowing for the assessment of the sensitivity and robustness of each investment horizon (1M, 3M, 6M, and 12M) under market stress conditions. The crises considered are:
- Dot-com bubble (2000–2002): collapse of the technology sector.
- Global financial crisis (2007–2009): subprime crisis and collapse of Lehman Brothers.
- European sovereign debt crisis (2010–2012): fiscal tensions in the European periphery.
- COVID-19 crisis (2020): liquidity shock and abrupt declines in global markets.
- Inflation crisis, restrictive monetary policy, and the conflict in Ukraine (2022): high global inflation, rate hikes, and geopolitical tensions.
The overlay of these zones allows for comparing cumulative performance under normal conditions and during episodes of severe disruption.
Traditional (cross-sectional) Momentum by horizon (1M, 3M, 6M, 12M)
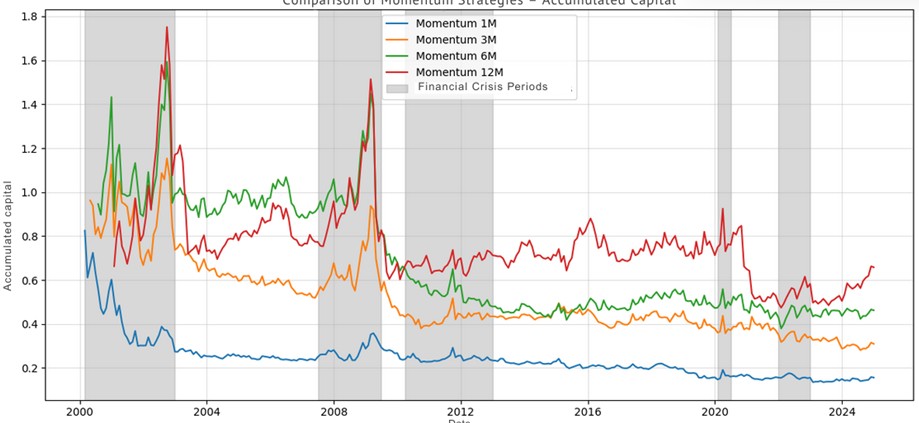
Figure 1 presents the evolution of cumulative capital for the traditional momentum strategies across horizons of 1, 3, 6, and 12 months. The results reflect a clear pattern: performance improves with the investment horizon, although with difficulties in maintaining sustained and stable capital growth over the long term.
In the short-term horizons (1M and 3M), the strategies show markedly weak performance, characterized by persistent capital loss. This behavior is consistent with the evidence of mean reversion at high frequencies documented by Jegadeesh and Titman (2011) and Lehmann (1990), which limits the ability to capture trends and reflects high sensitivity to market noise.
At the 6-month horizon, the strategy shows relatively more stable behavior, although with episodes of growth followed by abrupt declines, particularly during crisis periods. This pattern is consistent with the evidence of “momentum crashes” documented by Daniel and Moskowitz (2016), indicating that, although persistence is greater, reversal risk remains significant.
For its part, the 12-month horizon exhibits the best relative performance among the analyzed horizons, maintaining higher capital levels than the other periods. This result is consistent with the classic evidence identifying 12-month momentum as the most robust (Asness et al., 2013; Jegadeesh & Titman, 1993; 2001). Nevertheless, its trajectory shows episodes of high volatility and pronounced drawdowns, suggesting that its effectiveness is not completely stable over time.
Taken together, the evidence suggests that traditional momentum is highly dependent on the time horizon; while longer horizons better capture return persistence, short horizons are dominated by noise and reversal; however, the absence of sustained cumulative capital growth across all horizons suggests structural limitations in the ability of the traditional approach to generate consistent long-term returns.
Figure 1
Traditional Momentum Strategy 1M, 3M, 6M y 12M Long-Short
Source: Own elaboration.
Momentum Analysis with Supervised Learning – Random Forest Model
In this approach, a nonlinear supervised learning model based on Random Forest is incorporated, which classifies assets using multiple past returns as explanatory variables and an expected future return as the target variable. Unlike traditional momentum, this model can capture complex interactions and nonlinear patterns in the data, although its effectiveness depends on adequate calibration, data quality, and overfitting control.
The performance of the Random Forest strategy is evaluated for each of the investment horizons (1, 3, 6, and 12 months), allowing for comparison of its predictive ability against traditional momentum.
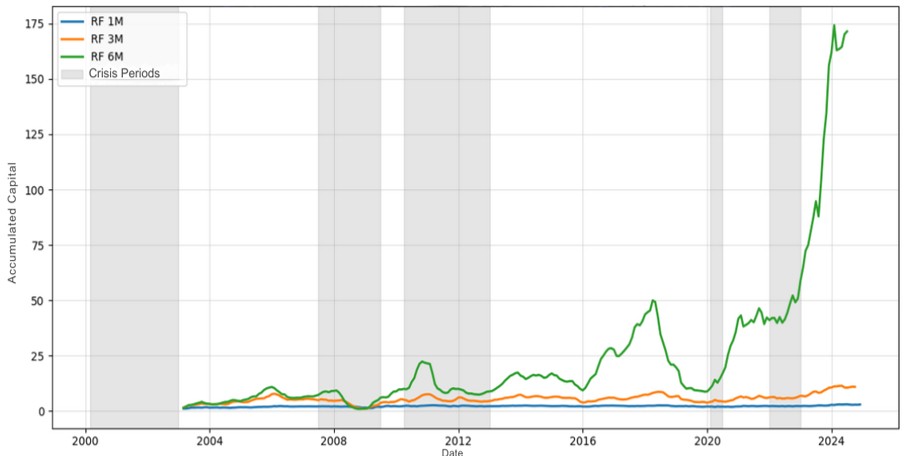
Figure 2 presents the evolution of cumulative capital for the Random Forest-based momentum strategies across horizons of 1, 3, and 6 months. The results show a clear relationship between the investment horizon and the strategy’s performance, showing that the model’s predictive ability improves as the analysis period increases.
At the one-month horizon, the strategy exhibits moderate growth and a relatively stable trajectory, suggesting a limited ability to extract predictive signals in the presence of high-frequency noise. In contrast, the 3-month horizon shows a substantial improvement in profitability, indicating that the model more effectively captures return persistence at intermediate horizons.
The most notable case corresponds to the six-month horizon, where a significant expansion of cumulative capital is observed, especially after June 2022, suggesting that the Random Forest model is more effective at identifying momentum patterns when these exhibit greater temporal stability. However, this higher level of profitability is accompanied by greater volatility and episodes of pronounced declines, reflecting an increase in risk exposure.
Taken together, the evidence indicates that model performance improves with the investment horizon, but at the cost of lower stability, reflecting a trade-off between return and risk. Likewise, it is observed that a significant part of the growth at the 6-month horizon is concentrated in recent periods, which suggests a possible dependence on specific market conditions (regime changes) and reinforces the need to interpret these results with caution.
Figure 2
Momentum Strategy 1M, 3M y 6M Long-Short with Random Forest
Source: Own elaboration.
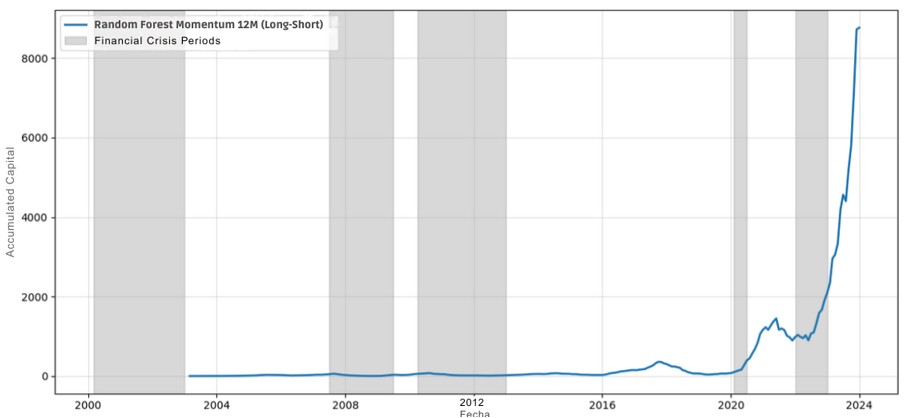
Figure 3 presents the evolution of cumulative capital for the Random Forest-based momentum strategy at the 12-month horizon. Unlike shorter horizons, this strategy exhibits the highest level of profitability, suggesting a greater ability of the model to capture long-run persistence patterns.
However, this performance is strongly concentrated in recent periods (after June 2022), suggesting a significant dependence on specific market conditions. In this sense, the accelerated growth in capital could be reflecting the exploitation of particular episodes of high profitability rather than stable structural relationships.
Likewise, the strategy presents the highest level of risk among all analyzed horizons, with extremely high drawdowns and high sensitivity to regime changes. Taken together, these results indicate that, although the model can generate significantly superior returns over long horizons, its stability is limited, requiring cautious interpretation from a practical implementation perspective.
Figure 3
Momentum Strategy 12M Long-Short with Random Forest
Source: Own elaboration.
Validating the performance of Traditional Momentum vs. Random Forest strategies for 1M, 3M, 6M y 12M
In order to assess the robustness of the performance of the momentum strategies, Table 1 presents the main backtest validation metrics for the 1, 3, 6, and 12 month horizons, comparing the traditional approach and the Random Forest-based model, both for the full sample (2000–2024) and for the restricted period (2000–June 2022).
The results indicate substantial differences between both approaches. In the case of traditional momentum, returns are consistently negative across most horizons, with compound annual growth rates (CAGR) ranging between -6.46% and -0.03% in the full sample. This suggests limitations of the traditional approach to generate sustained profitability over the analyzed period, especially over short and medium-term horizons.
In contrast, Random Forest-based strategies present numerically superior performance, with a systematic increase in returns as the investment horizon increases. In the full sample, CAGR rises from 4.91% in RF 1M to 52.00% in RF 12M, a pattern that holds in the restricted sample, although at lower levels (40.90% in RF 12M and 18.89% in RF 6M). This result suggests that the model appears to capture return persistence more effectively, but part of the performance is associated with recent market conditions.
In terms of risk, both approaches show an increase in volatility and drawdown as the time horizon widens. However, Random Forest strategies exhibit considerably higher levels of volatility and deeper drawdowns, reaching values close to -95% at the 12-month horizon. This shows that the improvement in profitability is accompanied by greater exposure to extreme events.
Risk-adjusted performance, measured through the Sharpe ratio, also favors the Random Forest model, especially over long horizons (0.95 in RF 12M versus values close to zero or negative in traditional momentum). However, this improvement is reduced in the restricted period, indicating that the model’s efficiency is not completely stable over time.
Taken together, the evidence suggests that, although the Random Forest-based approach significantly improves return generation ability compared to traditional momentum, this advantage is associated with a higher level of risk and a relevant dependence on specific market conditions. In this sense, performance evaluation should consider not only the magnitude of returns, but also their stability and feasibility of implementation.
Table 1
Comparison of performance and risk metrics: traditional momentum vs. Random Forest
Tradicional Momentum (MOM) |
Momentum Random Forest (RF) |
|||||||
Full Sample (2000 – 2024) |
||||||||
MOM 1M |
MOM 3M |
MOM 6M |
MOM 12M |
RF 1M |
RF 3M |
RF 6M |
RF 12M |
|
CAGR (%) |
-6.46 |
-4.48 |
-2.88 |
-0.03 |
4.91 |
9.68 |
25.01 |
52.00 |
Vol. Anual (%) |
19.55 |
21.39 |
23.65 |
24.89 |
18.24 |
30.06 |
42.13 |
54.68 |
Sharpe Ratio |
-0.33 |
-0.21 |
-0.12 |
0.00 |
0.27 |
0.32 |
0.59 |
0.95 |
Max. Drawdown (%) |
-83.61 |
-75.65 |
-76.17 |
-72.92 |
-44.17 |
-87.30 |
-91.84 |
-95.3 |
Hit Rate (%) |
47.65 |
50.68 |
51.19 |
54.36 |
52.11 |
57.14 |
62.50 |
63.20 |
PRE-2022 (2000 – Junio 2022) |
||||||||
MOM 1M |
MOM 3M |
MOM 6M |
MOM 12M |
RF 1M |
RF 3M |
RF 6M |
RF 12M |
|
CAGR (%) |
-6.92 |
-4.26 |
-3.07 |
-0.80 |
3.60 |
7.15 |
18.89 |
40.90 |
Vol. Anual (%) |
19.98 |
22.03 |
24.47 |
25.61 |
18.70 |
31.24 |
43.35 |
55.55 |
Sharpe Ratio |
-0.35 |
-0.19 |
-0.13 |
-0.03 |
0.19 |
0.23 |
0.44 |
0.74 |
Max. Drawdown (%) |
-82.37 |
-72.43 |
-76.17 |
-72.92 |
-44.17 |
-87.30 |
-91.84 |
-95.30 |
Hit Rate (%) |
46.64 |
50.75 |
51.33 |
53.31 |
51.29 |
55.60 |
59.91 |
60.78 |
Source: Own elaboration.
Table 2 presents the estimation of the alpha adjusted through the Fama–French–Carhart model for the traditional momentum and Random Forest strategies, both for the full sample and for the period prior to June 2022. The results show that traditional momentum does not generate statistically significant alphas in any of the analyzed horizons, suggesting that its performance can be explained by exposures to systematic risk factors.
In contrast, Random Forest-based strategies present positive and statistically significant alphas at intermediate and long horizons, particularly at 6M and 12M, where the t-stat and p-value values evidence robust statistical significance. This result indicates that the machine learning model manages to capture patterns in returns that are not explained by traditional risk factors. However, when restricting the analysis to the period prior to 2022, a slight reduction is observed in the magnitude and significance of the alphas, especially at shorter horizons, suggesting that part of the model’s performance may be influenced by recent market conditions. Taken together, these results reinforce the evidence that, although the Random Forest-based approach improves the ability to generate abnormal returns, its effectiveness is not completely stable over time.
Table 2
Alpha adjusted by the Fama-French-Carhart model for traditional momentum and Random Forest strategies
Tradicional Momentum (MOM) |
Momentum Random Forest (RF) |
|||||||
Full Sample (2000 – 2024) |
||||||||
MOM 1M |
MOM 3M |
MOM 6M |
MOM 12M |
RF 1M |
RF 3M |
RF 6M |
RF 12M |
|
Alpha (%) |
-0.2467 |
-0.1647 |
-0.0805 |
0.0466 |
-0.0902 |
1.0308 |
2.646 |
4.6533 |
Standard error |
0.2954 |
0.2811 |
0.2556 |
0.2023 |
0.2276 |
0.5486 |
0.7529 |
0.9965 |
t-stat |
-0.8352 |
-0.5858 |
-0.3148 |
0.2301 |
-0.3965 |
1.8789 |
3.5144 |
4.6695 |
p-value |
0.4043 |
0.5585 |
0.7532 |
0.8182 |
0.6921 |
0.0614 |
0.0005 |
0 |
N |
298 |
296 |
293 |
287 |
261 |
259 |
256 |
250 |
PRE-2022 (2000 – junio 2022) |
||||||||
MOM 1M |
MOM 3M |
MOM 6M |
MOM 12M |
RF 1M |
RF 3M |
RF 6M |
RF 12M |
|
Alpha (%) |
-0.2375 |
-0.1444 |
-0.0981 |
0.0208 |
-0.1453 |
0.9203 |
2.3056 |
4.0552 |
Standard error |
0.316 |
0.3033 |
0.2742 |
0.2168 |
0.2443 |
0.5977 |
0.8078 |
1.0438 |
t-stat |
-0.7514 |
-0.4761 |
-0.3579 |
0.096 |
-0.5948 |
1.5397 |
2.8542 |
3.885 |
p-value |
0.4531 |
0.6344 |
0.7207 |
0.9236 |
0.5526 |
0.125 |
0.0047 |
0.0001 |
N |
268 |
266 |
263 |
257 |
232 |
232 |
232 |
232 |
Source: Own elaboration.
Taken together, the results reflect that the use of Random Forest significantly improves the ability to generate returns compared to traditional momentum, particularly over intermediate and long horizons. This evidence is reinforced by the results in Table 2, where Random Forest-based strategies present positive and statistically significant alphas at 6- and 12-month horizons, even after controlling for the risk factors of the Fama–French–Carhart model.
In contrast, traditional momentum shows no evidence of abnormal return generation, which suggests that its performance can be largely explained by systematic exposures to risk factors. However, this improvement is not uniform or completely stable over time, as the highest profitability levels are associated with substantial increases in risk and a relevant dependence on specific market conditions, especially in recent periods. Likewise, when restricting the analysis to the period prior to 2022, a reduction is observed in the magnitude and significance of the alphas, suggesting that part of the model’s performance could be influenced by recent market dynamics.
In this sense, while traditional momentum presents weak and, in many cases, negative performance, the machine learning-based approach manages to capture nonlinear patterns that improve return prediction and generate additional economic value. However, this advantage comes accompanied by greater volatility, deeper drawdowns, and lower temporal consistency, posing a clear trade-off between profitability and stability.
Consequently, the results suggest that performance evaluation should not focus solely on the magnitude of returns, but also on their statistical robustness and feasibility of implementation. These findings reinforce the need to incorporate rigorous validation mechanisms and risk control when applying machine learning techniques in the construction of investment strategies.
Discussions
The results obtained in this study allow for the identification of consistent patterns in the effectiveness of momentum strategies, both in their traditional version and in their implementation through machine learning models. In particular, the comparison of investment horizons suggests that return predictability is not uniform, but depends on the time scale considered.
In the case of traditional momentum, the evidence supports that intermediate and long horizons present better relative performance, more consistently capturing the persistence of trends, while short-term horizons are affected by reversal and market noise (Daniel & Moskowitz, 2016; Jegadeesh & Titman, 1993). This result is consistent with the classic literature and reinforces the idea that momentum is a phenomenon dependent on the time horizon.
This result is also linked to the way momentum signals are constructed in the traditional approach, which are based on the cross-sectional ranking of past returns and the formation of long–short portfolios between winning and losing assets. While this methodology captures trend persistence, its effectiveness critically depends on the temporal stability of such signals and the absence of short-term reversal. In this sense, the results obtained suggest that, in the analyzed period, traditional signals show limitations in generating consistent returns, particularly over short horizons, where market noise and reversal significantly affect the model’s predictive ability.
Regarding implementation through Random Forest, the results show that the model appears to improve predictive ability compared to the traditional approach, particularly over intermediate and long horizons. However, this improved performance is not uniform. While the one-month horizon presents greater stability but limited profitability, the three- and six-month horizons achieve a better balance between return and risk, although with greater sensitivity to episodes of volatility and regime changes.
The case of the 12-month horizon is especially relevant. Although it presents the highest level of profitability and superior performance metrics, this behavior is highly concentrated in recent periods and is characterized by nonlinear dynamics, with episodes of accelerated growth followed by abrupt corrections. This pattern, together with the presence of extreme drawdowns, suggests that part of the performance could be associated with specific market conditions or overfitting problems, a phenomenon widely documented in the machine learning literature applied to finance (Gu et al., 2020).
From an asset pricing perspective, these results suggest that there are nonlinear patterns in return dynamics that are not fully captured by traditional models, and that can be modeled through machine learning techniques. However, the evidence also indicates that these patterns are not necessarily stable over time, and may depend on structural changes in the market, such as those observed in the period following the COVID-19 pandemic, characterized by greater concentration and dispersion of returns across assets.
This result is reinforced by the evidence presented in Table 2, where Random Forest-based strategies generate positive and statistically significant alphas at intermediate and long horizons, even after controlling for the risk factors of the Fama–French–Carhart model. In contrast, traditional momentum shows no evidence of abnormal returns, suggesting that its performance may be explained by systematic exposures. From this perspective, the results reinforce the idea that machine learning models capture nonlinear predictive components in certain periods and horizons, although this ability is not necessarily stable over time.
In terms of practical implications, the results show the existence of a clear trade-off between profitability and risk. While long horizons allow for higher return levels, they also imply greater exposure to extreme events and lower temporal stability. In this sense, the implementation of machine learning-based strategies requires complementing the asset selection process with risk control mechanisms, such as timing strategies or exposure reduction during periods of high volatility.
Nevertheless, this study presents certain limitations that should be considered; in particular, the use of a sample with continuously traded companies may introduce survivorship bias, and the absence of transaction costs could overestimate strategy performance. Likewise, although an out-of-sample validation scheme is employed, the results may be influenced by specific conditions of the analyzed period.
Finally, future research could extend this analysis by incorporating transaction costs, evaluating robustness in other markets, and exploring alternative machine learning models that improve prediction stability. Likewise, it is relevant to analyze the interaction between macroeconomic factors and predictive models, in order to better understand the dependence of performance on the market environment.
Taken together, the evidence suggests that, although the use of Random Forest improves the ability to capture momentum patterns, its effectiveness critically depends on the investment horizon, the market regime, and the implementation of adequate risk control mechanisms.
Conclusions
The empirical results provide evidence compatible with the persistence of momentum in the analyzed sample, particularly over intermediate and long horizons. In the traditional approach, the 12-month horizon presents the best relative performance, in line with the classic evidence (Jegadeesh & Titman, 1993; 2001), while short-term horizons (1M and 3M) show limited results due to high turnover, sensitivity to market noise, and the presence of mean reversion.
In relation to the research objective, the findings show that the Random Forest-based model presents relatively superior performance to traditional momentum in terms of return generation, especially over intermediate and long horizons. This suggests that nonlinear models can capture persistence patterns and complex relationships in financial data that are not identified by traditional linear approaches.
This result is reinforced by the evidence presented in Table 1, where it is observed that traditional momentum exhibits negative or near-zero returns across most horizons, while Random Forest-based strategies generate positive returns that increase with the investment horizon. In particular, the difference in terms of CAGR and Sharpe ratio between both approaches is substantial, suggesting that the machine learning model improves not only profitability but also efficiency in the risk-return relationship. However, this quantitative advantage comes accompanied by higher levels of volatility and drawdowns, reinforcing the existence of a structural trade-off between performance and stability.
This result is complemented by the evidence presented in Table 2, where it is observed that Random Forest-based strategies generate positive and statistically significant alphas at intermediate and long horizons, even after controlling for the risk factors of the Fama–French–Carhart model. In contrast, traditional momentum presents no evidence of abnormal return generation, suggesting that its performance can be explained primarily by systematic exposures. These findings reinforce the idea that machine learning models not only improve profitability but also capture additional informational components in returns that are not explained by traditional asset pricing models.
However, this improvement in performance is neither uniform nor completely robust. The results show that Random Forest-based strategies present higher levels of volatility and more pronounced drawdowns, particularly at the 12-month horizon, evidencing greater exposure to extreme risks. In this sense, a clear trade-off between profitability and stability is identified; while the machine learning approach offers higher potential returns, it also implies lower consistency over time.
Likewise, the robustness analysis shows that a significant part of the performance over long horizons is concentrated in recent periods, suggesting a relevant dependence on specific market conditions. This result raises questions about the generalization ability of these models and reinforces the need to interpret results derived from backtesting with caution.
In this context, the findings highlight the importance of complementing the use of machine learning models with robust validation and risk management mechanisms. In particular, out-of-sample validation, walk-forward analysis, and the incorporation of risk indicators to dynamically adjust portfolio exposure are essential to improving the stability and implementation feasibility of these strategies.
Finally, this study contributes to the literature by providing comparative evidence between traditional momentum strategies and machine learning-based approaches in a developed equity market. The results show that, although the use of Random Forest can improve predictive performance, its effectiveness critically depends on the investment horizon, the market regime, and the implementation of adequate risk control mechanisms. Future research could explore the incorporation of macroeconomic variables, hybrid models, and more advanced machine learning techniques, as well as assess the robustness of these approaches across different markets and economic contexts.
Ethical Considerations
This study did not require approval from an Ethics or Bioethics Committee, as it did not use any living resources, agents, biological samples, or personal data representing any risk to life, the environment, or human rights.
Conflict of interest
All authors made significant contributions to the document and declare that there is no conflict of interest related to this article.
Author Contribution Statement
Carlos Palomino Selem: conceptualization, methodology, formal analysis, supervision, project administration, validation, research, writing – original draft, writing: review and editing.
Ruth Milagros Delgado Yana: formal analysis, software, research, resources, data curation, writing – original draft, writing: review and editing, visualization.
Source of funding
Article funded with the authors’ own resources.
References
(1)Asness, C., Moskowitz, T. & Pedersen, L. (2013). Value and momentum everywhere. Journal of Finance, 68(3), 929–985. https://doi.org/10.1111/jofi.12021
(2)Bagnara, M. (2022). Asset pricing and machine learning: a critical review. Journal of Economic Surveys, 38(1), 27–56. https://doi.org/10.1111/joes.12532
(3)Bandarchuk, P. & Hilscher, J. (2013). Sources of momentum profits: evidence on the irrelevance of characteristics. Review of Finance, 17(2), 809–845. https://doi.org/10.1093/rof/rfr036
(4)Barberis, N., Shleifer, A. & Vishny, R. (1998). A model of investor sentiment. Journal of Financial Economics, 49(3), 307–343. https://doi.org/10.1016/S0304-405X(98)00027-0
(5)Beckmeyer, H. & Wiedemann, T. (2025). All days are not created equal: understanding momentum by learning to weight past returns. Journal of Banking & Finance, 181, 107565. https://doi.org/10.1016/j.jbankfin.2025.107565
(6)Bui, D. G., Kong, D. R., Lin, C. Y. & Lin, T. C. (2023). Momentum in machine learning: evidence from the Taiwan stock market. Pacific-Basin Finance Journal, 82, 102178. https://doi.org/10.1016/j.pacfin.2023.102178
(7)Carhart, M. M. (1997). On persistence in mutual fund performance. Journal of Finance, 52(1), 57–86. https://doi.org/10.2307/2329556
(8)Zhang, C. (2022). Asset Pricing and Deep Learning. Cornell University - arXiv. https://doi.org/10.48550/arXiv.2209.12014
(9)Chin, J. T., Lin, H. & Mei, Y. (2022). Machine learning and the cross-section of stock returns. SSRN Electronic Journal. https://doi.org/10.2139/ssrn.4282614
(10)Chui, A., Titman, S. & Wei, K. (2010). Individualism and momentum around the world. The Journal of Finance, 65(1), 361–392. https://doi.org/10.1111/j.1540-6261.2009.01532.x
(11)Conrad, J. & Kaul, G. (1998). An Anatomy of trading strategies. The Review of Financial Studies, 11(3), 489–519. https://doi.org/10.1093/rfs/11.3.489
(12)Daniel, K. & Moskowitz, T. (2016). Momentum crashes. Journal of Financial Economics, 122(2), 221–247. https://doi.org/10.1016/j.jfineco.2015.12.002
(13)Fama, E. & French, K. (1996). Multifactor explanations of asset pricing anomalies. Journal of Finance, 51(1), 55–84. https://doi.org/10.2307/2329302
(14)Fama, E. (1970). Efficient capital markets: a review of theory and empirical work. Journal of Finance, 25(2), 383-417. https://doi.org/10.2307/2325486
(15)Fieberg, C., Metko, D., Poddig, T. & Loy, T. (2023). Machine learning techniques for cross-sectional equity returns prediction. OR Spectrum, 45, 289–323. https://doi.org/10.1007/s00291-022-00693-w
(16)Goyal, A., Jegadeesh, N. & Subrahmanyam, A. (2025). Empirical determinants of momentum: a perspective using international data. Review of Finance, 29(1), 241–273. https://doi.org/10.1093/rof/rfae038
(17)Gu, S., Kelly, B. & Xiu, D. (2020). Empirical asset pricing via machine learning. Review of Financial Studies, 33(5), 2223–2273. https://doi.org/10.1093/rfs/hhaa009
(18)Healy, J. V., Gregoriou, A. & Hudson, R. (2024). Automated machine learning and asset pricing. risk, 12(9), 148. https://doi.org/10.3390/risks12090148
(19)Hong, H. & Stein, J. (1999). A unified theory of underreaction, momentum trading, and overreaction in asset markets. The Journal of Finance, 54(6), 2143–2184. https://doi.org/10.1111/0022-1082.00184
(20)Jegadeesh, N. & Titman, S. (1993). Returns to buying winners and selling losers: implications for stock market efficiency. Journal of Finance, 48(1), 65-91. https://doi.org/10.2307/2328882
(21)Jegadeesh, N. & Titman, S. (2001). Profitability of momentum strategies: an evaluation of alternative explanations. The Journal of Finance, 56(2), 699–720. https://doi.org/10.1111/0022-1082.00342
(22)Jegadeesh, N. & Titman, S. (2011). Momentum. Annual Review of Financial Economics, 3, 493–509. https://doi.org/10.1146/annurev-financial-102710-144850
(23)Krauss, C., Do, X. & Huck, N. (2017). Deep neural networks, gradient-boosted trees, random forests: statistical arbitrage on the S&P 500. European Journal of Operational Research, 259(2), 689–702. https://doi.org/10.1016/j.ejor.2016.10.031
(24)Lehmann, B. N. (1990). Fads, martingales and market efficiency. The Quarterly Journal of Economics, 105(1), 1–28. https://doi.org/10.2307/2937816
(25)Liao, Y., Ma, X., Neuhierl, A. & Schilling, L. (2025). The uncertainty of machine learning predictions in asset pricing. arXiv preprint. https://doi.org/10.48550/arXiv.2503.00549
(26)Lo, A. W. (2004). The adaptive markets hypothesis. Journal of Portfolio Management, 30(5), 15-29. https://doi.org/10.3905/jpm.2004.442611
(27)López, M. (2018). Advances in financial machine learning. Wiley. https://www.wiley.com/en-us/Advances+in+Financial+Machine+Learning-p-9781119482086
(28)Mattusch, M. (2024). Generative AI for european asset pricing: alleviating the momentum anomaly. The European Journal of Finance, 31(7), 850–888. https://doi.org/10.1080/1351847X.2024.2439979
(29)Novy-Marx, R. (2012). Is momentum really momentum? Journal of Financial Economics, 103(3), 429-453. https://doi.org/10.1016/j.jfineco.2011.05.003
(30)Rouwenhorst, K. (1998). International momentum strategies. Journal of Finance, 53(1), 267–284. https://doi.org/10.1111/0022-1082.95722
(31)Shiller, R. J. (2003). From efficient markets theory to behavioral finance. Journal of Economic Perspectives, 17(1), 83-104. https://doi.org/10.1257/089533003321164967
(32)Yao, H., Zhang, X., Zhou, G. & Yang, C. (2022). Six-factor asset pricing and portfolio investment via deep learning: evidence from the Chinese stock market. Pacific-Basin Finance Journal, 76, 101886. https://doi.org/10.1016/j.pacfin.2022.101886
(33) Ye, J., Goswami, B., Gu, J., Uddin, A. & Wang, G. (2024). From factor models to deep learning: Machine learning in reshaping empirical asset pricing. arXiv preprint. https://doi.org/10.48550/arXiv.2403.06779