https://doi.org/10.22267/rtend.26272.300
Research article
Finance
Optimization of Peruvian mutual fund portfolios using the Markowitz and Black-Litterman Models, 2010–2025
Optimización de portafolios de fondos mutuos peruanos mediante los modelos de Markowitz y Black-Litterman, 2010-2025
Otimização de carteiras de fundos mútuos peruanos por meio dos modelos de Markowitz e Black-Litterman, 2010-2025
By: Luis Enrique Cayatopa-Rivera 1; Carmen Patricia Peralta-Gonzales2; Lily Tatiana León-Echevarría3; Henry Cóndor-Lucchini4
1Master in Public Administration, Universidad Católica Sedes Sapientiae. Professor, Graduate School of the Faculty of Economic and Commercial Sciences, Universidad Católica Sedes Sapientiae. ORCID: 0000-0002-6359-2125. E-mail: lcayatopa@ucss.edu.pe, Lima - Perú.
2 Economic Engineer, Universidad Nacional del Altiplano. Professor at Universidad Nacional de Huancavelica. ORCID: 0000-0002-3869-0284. E-mail: carmen.peralta@unh.edu.pe, Huancavelica – Perú.
3 Master in Public Management for Development, Universidad Nacional Hermilio Valdizán de Huánuco. Specialist at the Regional Government of Huánuco. ORCID: 0009-0009-7394-6255. E-mail: lleon@regionhuanuco.gob.pe, Huánuco-Perú.
4 Master in Buisness Administration and Management, Universidad Europea del Atlántico (España). Professor at Universidad Nacional Mayor de San Marcos. ORCID: 0000-0003-4591-9021. E-mail: henry.condor1@unmsm.edu.pe, Lima-Perú.
Received: January 5, 2026 Accepted: June 16, 2026
DOI: https://doi.org/10.22267/rtend.26272.300
How to cite this article: Cayatopa, L., Peralta, C., León, L. & Cóndor, H. (2026). Optimization of Peruvian mutual fund portfolios using the Markowitz and Black-Litterman Models, 2010–2025. Tendencias, 27(2), 147-173. https://doi.org/10.22267/rtend.26272.300

Abstract
Introduction: This study analyzes the optimization of Peruvian mutual fund portfolios and the effect of the denomination currency on the relationship between risk, return, and diversification. Objective: To compare the performance of the Markowitz and Black-Litterman models in estimating efficient frontiers and constructing optimal portfolios for mutual funds denominated in soles, dollars, and an integrated portfolio combining both currencies during 2010–2025. Methodology: A quantitative, non-experimental, longitudinal study was conducted using monthly quota values of 31 mutual funds reported by Peru’s Superintendencia del Mercado de Valores. Returns, volatilities, Sharpe ratios, tangent portfolios, and efficient frontiers were calculated under non-negativity and maximum asset-weight constraints. Results: Soles-denominated funds showed greater relative efficiency; Markowitz produced more conservative portfolios and better Sharpe ratios, while Black-Litterman achieved higher cumulative returns in dollar and integrated portfolios, albeit with greater volatility. Discussion: The findings confirm that portfolio efficiency does not depend solely on the optimization model, but also on the denomination currency, the risk structure of the funds, and the evaluation criterion adopted. In this regard, Markowitz proves more consistent for defensive strategies oriented toward risk-adjusted efficiency, while Black-Litterman allows incorporating market expectations and shifting the portfolio toward higher potential returns, with greater risk exposure. Conclusions: Both models are complementary; Markowitz favors risk-adjusted efficiency, and Black-Litterman incorporates expectations to expand return opportunities.
Keywords: financial management; risk management; investment; liquidity; financial market.
JEL: C58; C61; D81; G11; G12; G23.
Resumen
Introducción: El estudio analiza la optimización de portafolios de fondos mutuos peruanos y el efecto en la moneda de denominación sobre la relación entre riesgo, retorno y diversificación. Objetivo: Comparar el desempeño de los modelos de Markowitz y Black-Litterman en la estimación de fronteras eficientes y la construcción de carteras óptimas en fondos mutuos denominados en soles, dólares y un portafolio integrado por ambas monedas durante 2010-2025. Metodología: Se desarrolló una investigación cuantitativa, no experimental y longitudinal, con valores de cuota mensuales de 31 fondos mutuos reportados por la Superintendencia del Mercado de Valores. Se calcularon retornos, volatilidades, ratios de Sharpe, carteras tangentes y fronteras eficientes bajo restricciones de no negatividad y peso máximo por activo. Resultados: Los fondos en soles mostraron mayor eficiencia relativa; Markowitz presentó carteras más conservadoras y mejores ratios de Sharpe, mientras Black-Litterman alcanzó mayores retornos acumulados en dólares e integrados, aunque con mayor volatilidad. Discusión: Los hallazgos confirman que la eficiencia de los portafolios no depende únicamente del modelo de optimización, sino también de la moneda de denominación, la estructura de riesgo de los fondos y el criterio de evaluación adoptado. En ese sentido, Markowitz resulta más consistente para estrategias defensivas orientadas a eficiencia ajustada por riesgo, a la vez que Black-Litterman permite incorporar expectativas de mercado y desplazar la cartera hacia mayores retornos potenciales, con una exposición superior al riesgo. Conclusiones: Ambos modelos son complementarios; Markowitz favorece eficiencia ajustada por riesgo y Black-Litterman incorpora expectativas para ampliar oportunidades de retorno.
Palabras clave: administración financiera; gestión de riesgos; inversión; liquidez; mercado financiero.
JEL: C58; C61; D81; G11; G12; G23.
Resumo
Introdução: O estudo analisa a otimização de carteiras de fundos de investimento peruanos e o efeito da moeda de denominação na relação entre risco, retorno e diversificação. Objetivo: Comparar o desempenho dos modelos de Markowitz e Black-Litterman na estimativa de fronteiras eficientes e na construção de carteiras ótimas em fundos de investimento denominados em soles, dólares e numa carteira composta por ambas as moedas durante o período de 2010 a 2025. Metodologia: Foi desenvolvida uma investigação quantitativa, não experimental e longitudinal, com valores mensais das quotas de 31 fundos de investimento comunicados pela Superintendência do Mercado de Valores. Foram calculados retornos, volatilidades, rácios de Sharpe, carteiras tangentes e fronteiras eficientes sob restrições de não negatividade e peso máximo por ativo. Resultados: Os fundos em soles apresentaram maior eficiência relativa; o modelo de Markowitz apresentou carteiras mais conservadoras e melhores rácios de Sharpe, enquanto o modelo de Black-Litterman alcançou maiores retornos acumulados em dólares e integrados, embora com maior volatilidade. Discussão: Os resultados confirmam que a eficiência das carteiras não depende apenas do modelo de otimização, mas também da moeda de denominação, da estrutura de risco dos fundos e do critério de avaliação adotado. Nesse sentido, o modelo de Markowitz revela-se mais consistente para estratégias defensivas orientadas para a eficiência ajustada ao risco, enquanto o modelo de Black-Litterman permite incorporar as expectativas do mercado e orientar a carteira para maiores retornos potenciais, com uma exposição superior ao risco. Conclusões: Ambos os modelos são complementares; o modelo de Markowitz privilegia a eficiência ajustada ao risco, enquanto o modelo de Black-Litterman incorpora expectativas para ampliar as oportunidades de retorno.
Palavras-chave: gestão financeira; gestão de risco; investimento; liquidez; mercado financeiro.
JEL: C58; C61; D81; G11; G12; G23.
Introduction
Mutual funds constitute relevant collective investment vehicles because they allow channeling resources toward professionally managed portfolios, with different levels of risk, liquidity, and expected return. In this market, the investment decision depends not only on the historical profitability of the assets, but also on market volatility, the denomination currency, and the portfolio’s diversification capacity.
On this point, it should be noted that international evidence shows that stock markets receive global and regional financial shocks that affect diversification. Likewise, volatility, financial contagion, and stock market interdependencies influence portfolio decisions (Cayatopa & Bendezú, 2025; Reyes, 2016; Urdaneta et al., 2021).
This framework is especially relevant for the study of mutual funds, since the efficiency of their portfolios depends on the quality of diversification and the ability to incorporate signals coming from both the local market and the regional and international environment. Consequently, analyzing the construction of efficient portfolios in the Peruvian market requires recognizing that mutual fund quota values not only reflect internal asset allocation decisions, but also exposure to episodes of volatility, financial contagion, and stock market interdependence at different levels of the economic system.
In this context, the research problem centers on the limited empirical evidence comparing the ability of the Markowitz and Black-Litterman models to construct efficient portfolios of Peruvian mutual funds, differentiating by denomination currency. The question guiding the study is: How do the efficient frontiers, tangent portfolios, and risk-return indicators generated by both models differ for mutual funds denominated in soles, dollars, and an integrated portfolio combining both currencies during 2010–2025?
Empirical background and research gap
The empirical literature continues to regard the mean-variance approach as a central reference for portfolio selection. Anuno et al. (2024), Chaweewanchon and Chaysiri (2022), Chen and Zhou (2022), Elavia et al. (2022), Irhamni (2024), Mallieswari et al. (2024), Nolan et al. (2021), and Škrinjarić (2019) show that diversification, rebalancing, and reoptimization remain useful mechanisms for improving the risk-return relationship, although the classic model requires explicit assumptions and constraints.
In a complementary manner, it is noted that empirical efficiency depends on the quality of means, covariances, and constraints; concentration, multicollinearity, scenario filtering, regularization, liquidity, and risk budgets can modify the optimal solution (Barro et al., 2024; Cao & Li, 2024; Cetingoz et al., 2024; Gubu & Hilmi, 2024; Hediger & Näf, 2024; Ortiz et al., 2023; Puerto et al., 2022; Sadik et al., 2024; Senthilkumar et al., 2022).
Along these lines, Markowitz (1952) has gained relevance because it combines equilibrium returns with investor views. In this regard, Luna and Agudelo (2019) show its empirical usefulness in portfolios of the Latin American Integrated Market, which is pertinent for emerging markets and for exercises in which expectations modify the optimal allocation.
For its part, the literature on mutual funds emphasizes that performance should be assessed using risk-adjusted indicators and not only observed returns. Sharpe (1966) opened this line of evaluation, and Hilario et al. (2020) extend the discussion toward fund portfolios under multiple criteria.
In Peru, Ames (2012), Castillo and Lama (1998), Pacheco (2018), Quintana (2015), and Yong (2011) addressed performance, diversification, efficiency, and market structure. However, the evidence remains concentrated on ex post diagnostics and specific industry segments.
The research gap lies in the absence of a systematic comparison between Markowitz and Black-Litterman or other models applied to Peruvian mutual funds with differentiation by currency. This study provides that contrast based on soles-denominated funds, dollar-denominated funds, and an integrated basket.
The mutual fund market
According to Peru’s Superintendencia del Mercado de Valores (SMV, 2021), a mutual fund pools voluntary contributions from individuals and legal entities so that a management company can invest them with the objective of obtaining profitability. The quota value allows approximating the fund’s performance and constitutes the operational input for constructing the return series used in this research.
Mutual funds can generally be classified into fixed income, mixed income, and equity income. The first prioritize debt instruments and lower volatility; the second combine debt and equities; and the third assume greater exposure to stocks and, therefore, to market fluctuations. In Peru, their management corresponds to Mutual Fund Management Companies, under the supervision of the SMV.
Based on the foregoing, the objective of this study is to comparatively assess the efficient frontiers, the composition of the tangent portfolios, and the risk-return performance indicators obtained through the Markowitz and Black-Litterman models in Peruvian mutual funds denominated in soles, dollars, and in an integrated portfolio combining both currencies during the 2010–2025 period. This expands the applied literature on portfolio optimization and currency differentiation in the Peruvian market.
Methodology
This research was developed using a quantitative approach, non-experimental design, and longitudinal scope, applying the portfolio management models of Harry Markowitz (1952) and Black and Litterman (1992).
The research period covered the analysis of monthly returns from January 2010 to December 2025. The Python programming language was used for all procedures, including scraping, data analysis, and plotting libraries.
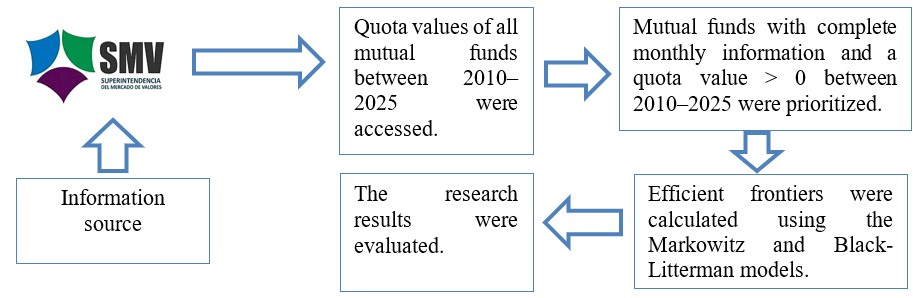
Data were collected from the SMV’s mutual fund statistical portal (SMV, 2026), following the research path shown in Figure 1.
Regarding data access and analysis, in a first stage, the quota values and net asset records of all mutual funds registered at the close of each month-end were accessed using scraping techniques, from December 31, 2009, to December 31, 2025. In a second stage, in order to obtain a balanced panel, all mutual funds that recorded complete information for the entire analysis period and that also showed a quota value greater than zero were selected. Thus, this research analyzed a total of 31 mutual funds, distributed among fixed income, equity income, and mixed income funds (Table 1), duly quoted in both soles and dollars (for further detail, see Annex 1).
Figure 1
Data collection and analysis process
Source: Own elaboration.
The decision to work with a balanced panel responds to a criterion of internal comparability, where both models require complete return matrices to estimate means, variances, covariances, and optimal weights under the same universe of assets. However, this inclusion rule may generate survivorship bias, to the extent that it excludes funds without continuity throughout the entire period. Consequently, the results are circumscribed to funds with a complete operational history between 2010 and 2025, and should not be interpreted as exhaustive inference about the entirety of existing, liquidated, merged, or newly incorporated funds during the period. This limitation is relevant in financial performance studies, as the selection of surviving series can alter the historical assessment of returns and risks (Brown et al., 1992).
Table 1
Summary of prioritized mutual funds (n=31)
Category |
Number of funds |
Participation (%) |
Fixed income |
11 |
35.48 |
Mixed income |
16 |
51.61 |
Equity income |
4 |
12.90 |
Source: Own elaboration.
In the third and fourth stages, the monthly return matrix was determined, and the investment frontiers were calculated using the Markowitz and Black-Litterman models, respectively.
In line with the above, the mathematical formulation of the Markowitz (1952) and Black and Litterman (1992) models is presented below, adapted to the case of Peruvian mutual funds based on monthly quota value information. The presentation incorporates the constraints actually used in constructing the study’s optimal portfolios.
Let  be the quota value of mutual fund
  in month
  , where
  , noting that for this study
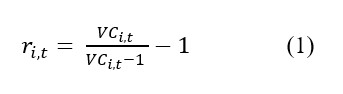
  . Based on this information, the monthly return of each fund was calculated (Equation 1):
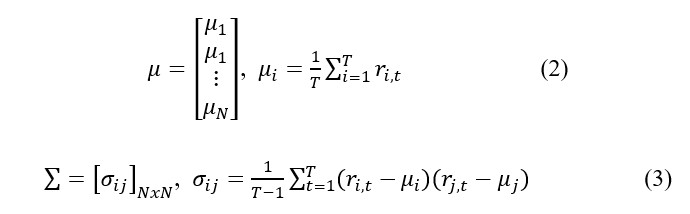
Based on the calculation of the monthly return matrix, the vector of expected returns and the sample variance-covariance matrix were estimated (Equations 2 and 3):
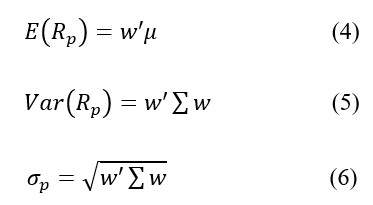
Let  be the portfolio weight vector. In turn, expected return and its variance are expressed in Equations 4, 5, and 6.
Markowitz Model
In general terms, the Markowitz efficient frontier is obtained by solving the minimum-variance problem for a target return  (Equation 7):
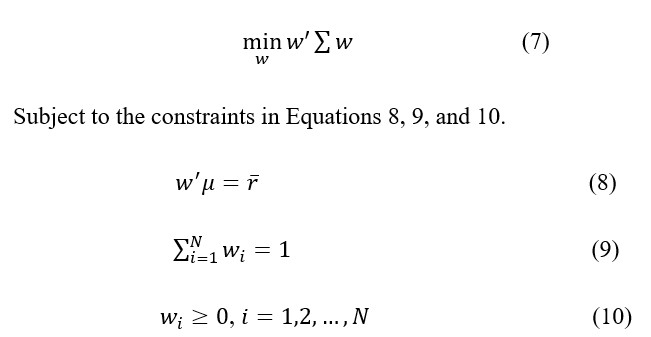
It should be noted that the maximum Sharpe ratio was used to calculate this study’s tangent portfolio. The resulting optimization problem was thus formulated based on Equation 11.

Where  represents the risk-free rate. For purposes of this study,
  , so the simplified function was expressed in Equation 12.

Subject to the constraints in Equations 13 and 14.
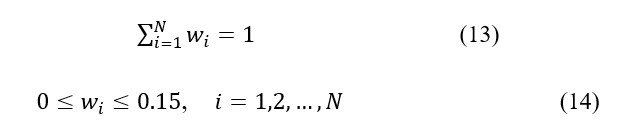 It should be noted that the constraint in Equation 14 encompasses two operational assumptions of this research. First, short sales are not allowed, so all weights must be non-negative. Second, no fund may represent more than 15% of the portfolio, which introduces an upper diversification bound and avoids excessively concentrated solutions.
The choice of a zero risk-free rate was incorporated as a comparative normalization and not as a literal representation of a Peruvian market rate. Under this convention, the Sharpe ratio should be read as an internal measure of return per unit of homogeneous volatility, used to compare the portfolios generated by both models under the same reference assumption. This clarification is necessary because the Sharpe ratio is defined over differential returns relative to a benchmark or risk-free asset; therefore, its operational interpretation requires caution when this component is normalized to zero (Sharpe, 1994).
Black-Litterman Model
The Black-Litterman model starts from a vector of implied equilibrium returns, obtained from the covariance matrix and a reference portfolio. In this study, that reference portfolio was constructed using market weights approximated by the average share of each fund’s assets under management. Let  be the weight vector. Accordingly, the equilibrium return vector was defined in Equation 15.

Where  is the market risk-aversion coefficient, which for this study was set at
  . In addition, the model introduces the parameter
  which scales the uncertainty of the equilibrium prior. It should be noted that
  was used. Under this approach, the prior on expected returns was expressed in Equation 16.

Accordingly, the central procedure of the model consists of incorporating views; that is, investor judgments about return differentials between groups of assets, which are summarized in Equation 17.
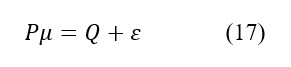
Where  is the view exposure matrix,
  is the vector of expected returns associated with the stated views, and
  is the error term distributed as
  .
.
On this point, three relative views were used. The first view held that medium-term soles-denominated debt funds should outperform short-term soles-denominated debt funds. The second view posited that moderate mixed-income soles-denominated funds should outperform short-term dollar-denominated debt funds. The third view indicated that equity income should outperform funds of funds.
The incorporated views are not presented as structural market truths, but as ex ante assumptions of a comparative scenario. Their function is to assess how the optimal allocation changes when the equilibrium prior is adjusted with relative judgments about observable segments of the Peruvian mutual fund market. In particular, the views favor contrasts between short- and medium-term debt, moderate mixed funds and funds of funds, as well as equity income versus diversified vehicles, in order to represent reasonable hypotheses about term premiums, risk exposure, and return accumulation. This reading is consistent with the logic of the Black-Litterman model, which combines equilibrium returns with investor opinions weighted by their confidence level (He & Litterman, 2002; Idzorek, 2004).
Mathematically, these views can be represented in Equations 18 and 19.
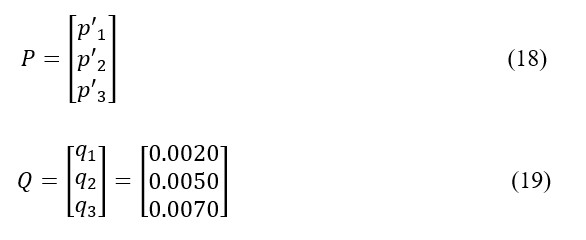 Where the elements of
  assign positive weights to the group of funds favored by the view and negative weights to the compared group. It should be mentioned that the matrix
  captures the uncertainty associated with each view. In this research, this uncertainty was constructed based on specific confidence levels (0.80, 0.08 and 0.60, respectively, for each view), such that
  is expressed in Equation 20.

Where  represents the level of confidence assigned to view k.
The assigned confidence levels should be interpreted as research parameters and not as estimates observed directly from the market. Greater confidence increases the influence of the view on the posterior returns, while lower confidence preserves greater proximity to the equilibrium portfolio. For this reason, the results of the Black-Litterman model are reported as dependent on the calibration adopted. A natural extension of the study would be to test the sensitivity of the portfolios to alternative values of risk aversion, tau, and confidence, especially if the objective were to move from a historical comparison to an operational investment recommendation.
Based on the structure presented, the posterior vector of expected returns under the Black-Litterman model framework was expressed in Equation 21.
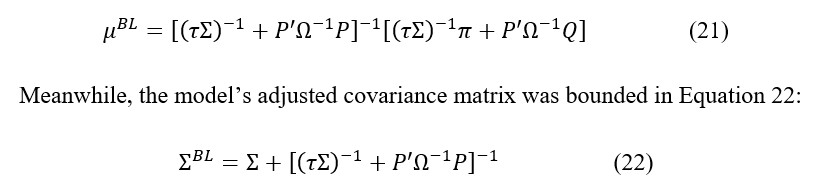
Having calculated  and
and  , the Black-Litterman tangent portfolio was calculated by again solving the maximum-Sharpe problem (Equation 23).
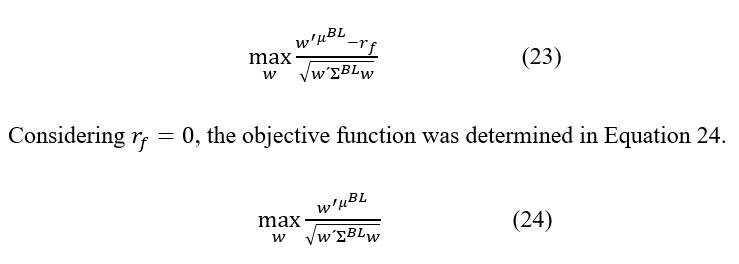
Subject to the same constraints set out in Equations 13 and 14.
In comparative terms, the Markowitz model exclusively uses the historical information contained in  and
and  , while the Black-Litterman model combines this statistical base with an additional block of structured beliefs, summarized in
  ,
,  , and
, and  , differing in the way the vector of expected returns is constructed, which determines the final portfolio decision.
Results
The results are presented for 31 mutual funds with complete information during 2010–2025. The reading should be circumscribed to surviving funds and to an in-sample historical comparison, differentiated between soles-denominated funds, dollar-denominated funds, and an integrated portfolio.
Table 2 shows that soles-denominated funds concentrated higher cumulative medians than dollar-denominated funds. In soles, fixed income and equity income reached 71.22% and 70.44%, respectively; in dollars, the values were more moderate, showing that currency modifies the reading of historical performance.
Table 2
Median cumulative return of the analyzed mutual funds, by category and currency (2010-2025)
Group |
Category |
Funds |
Median cumulative return (%) |
Soles funds |
Fixed income |
6 |
71,22 |
Soles funds |
Mixed income |
9 |
49,59 |
Soles funds |
Equity income |
2 |
70,44 |
Dollar funds |
Fixed income |
5 |
29,51 |
Dollar funds |
Mixed income |
7 |
35,56 |
Dollar funds |
Equity income |
2 |
41,37 |
Source: Own elaboration.
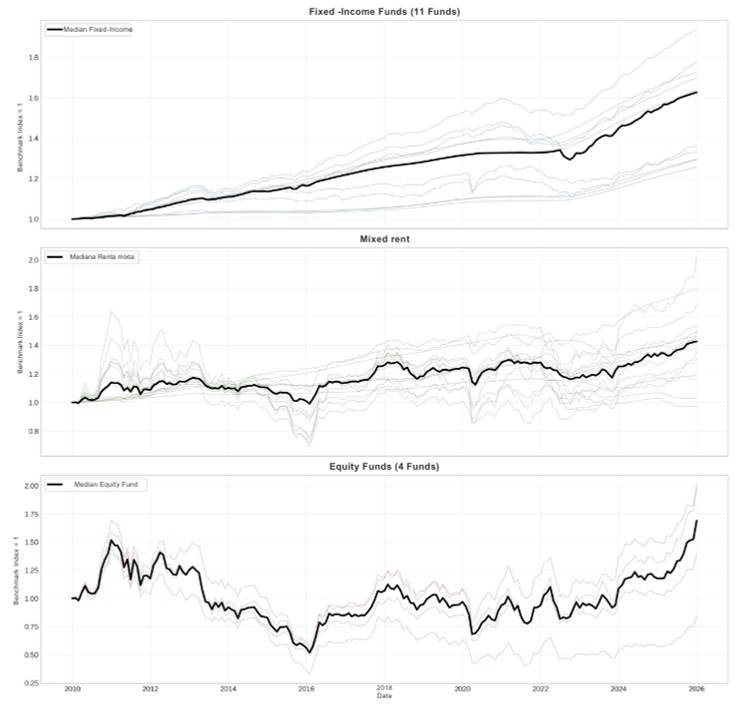
In turn, the historical evolution of the normalized funds (Figure 2) shows that the trajectories were not homogeneous across categories. Along these lines, it is revealed that equity income mutual funds exhibited greater dispersion among funds, while fixed income maintained a more stable and compact trajectory.
Figure 2
Historical evolution of the analyzed mutual funds by category (2010-2025)
Source: Own elaboration.
Descriptive analysis
Table 3 shows that soles-denominated fixed income was the segment with the best relative efficiency, with an average annual return of 3.45%, volatility of 1.35%, and a Sharpe ratio of 3.72. Equity income recorded higher average returns, but also higher volatility, which reduced its risk-adjusted performance (for further detail, see Annex 2).
Table 3
Descriptive statistics of the analyzed mutual funds by category (2010-2025)
Group |
Category |
Funds |
Annual return (%) |
Annual vol. (%) |
Sharpe |
Soles funds |
Fixed income |
6 |
3,45 |
1,35 |
3,72 |
Soles funds |
Mixed income |
9 |
2,87 |
7,94 |
0,50 |
Soles funds |
Equity income |
2 |
5,06 |
19,12 |
0,26 |
Dollar funds |
Fixed income |
5 |
1,69 |
1,41 |
2,13 |
Dollar funds |
Mixed income |
7 |
1,90 |
5,72 |
0,52 |
Dollar funds |
Mixed income |
2 |
4,20 |
22,82 |
0,19 |
Source: Own elaboration.
Markowitz Model Results
Markowitz optimization (Table 4) converged under non-negativity and 15% maximum asset-weight constraints. The model generated conservative portfolios: in soles it reached an annualized return of 3.30%, volatility of 1.01%, and Sharpe of 3.21; in dollars, 1.76%, 1.16%, and 1.51; and in the integrated portfolio, 2.41%, 0.43%, and 5.49, respectively.
Table 4
Composition of the Markowitz tangent portfolio
Portfolio |
Mutual fund |
Weight (%) |
Soles |
CC conservative medium-term |
15,00 |
Credicorp conservative liquidity |
15,00 |
|
BBVA short-term income |
15,00 |
|
BBVA médium-term income |
15,00 |
|
BBVA cash |
15,00 |
|
Scotia cash fund |
15,00 |
|
IF medium-term |
8,03 |
|
IF flexible investment |
1,97 |
|
Dollars |
Scotia cash fund |
15,00 |
FdF BBVA global conservative |
15,00 |
|
Credicorp conservative liquidity |
15,00 |
|
BBVA cash |
15,00 |
|
BBVA short-term income |
15,00 |
|
Credicorp conservative liquidity |
15,00 |
|
BBVA medium-term income |
10,00 |
|
Integrated |
BBVA cash [dollars] |
15,00 |
BBVA cash [soles] |
15,00 |
|
BBVA short-term income [soles] |
15,00 |
|
Credicorp conservative liquidity [dollars] |
15,00 |
|
Credicorp conservative liquidity [soles] |
15,00 |
|
Scotia cash fund [soles] |
14,71 |
|
BBVA short-term income [dollars] |
10,29 |
Source: Own elaboration.
The integrated basket allowed combining low-volatility funds in both currencies, which explains the higher Sharpe ratio obtained by Markowitz.
Black-Litterman Model Results
Black-Litterman maintained a significant presence of fixed income, but incorporated medium-term, mixed income, and equity income funds more heavily (Table 5). In soles it obtained an annualized return of 3.29%, volatility of 1.54%, and Sharpe of 2.10; in dollars, 2.07%, 7.72%, and 0.30; and in the integrated portfolio it achieved the highest cumulative return of the exercise, at 58.26%.
Table 5
Composition of the Black-Litterman tangent portfolio
Portfolio |
Mutual fund |
Weight (%) |
Soles (First and third views applied) |
BBVA medium-term income |
15,00 |
IF medium term |
15,00 |
|
Credicorp conservative liquidity |
15,00 |
|
CC conservative medium-term |
15,00 |
|
BBVA short-term income |
14,56 |
|
Credicorp moderate VCS |
11,45 |
|
Scotia cash fund |
7,32 |
|
Scotia Premium fund |
4,40 |
|
BBVA cash |
2,27 |
|
Dollars (Third view applied) |
BBVA cash |
15,00 |
BBVA short-term income |
15,00 |
|
Credicorp conservative liquidity |
15,00 |
|
Credicorp capital equities |
15,00 |
|
Promoinvest selective fund |
15,00 |
|
Scotia cash fund |
15,00 |
|
IF balanced mixed |
6,18 |
|
Credicorp balanced |
2,21 |
|
Scotia premium fund |
1,61 |
|
Integrated (First, second, and third views applied) |
IF medium-term [soles] |
15,00 |
Credicorp moderate VCS [soles] |
15,00 |
|
BBVA medium-term income [soles] |
15,00 |
|
CC conservative medium-term [soles] |
15,00 |
|
BBVA cash [dollar] |
14,46 |
|
Scotia cash fund [soles] |
11,65 |
|
FdF BBVA global conservative [dollars] |
6,24 |
|
BBVA short-term income [soles] |
3,81 |
|
Scotia premium fund [soles] |
2,47 |
|
BBVA medium-term income [dollars] |
0,99 |
|
IF flexible investment [soles] |
0,26 |
|
Scotia cash fund [dollars] |
0,13 |
Source: Own elaboration.
Comparative Analysis
Table 6 confirms that dominance depends on the evaluation criterion. Markowitz presents the greatest risk-adjusted efficiency, especially in the integrated portfolio, while Black-Litterman achieves higher cumulative return in dollars and in the integrated portfolio, with greater volatility.
Table 6
Comparison between the Markowitz and Black-Litterman tangent portfolios
Portfolio |
Model |
Annual return (%) |
Annual vol. (%) |
Sharpe |
Cumulative return (%) |
Soles |
Markowitz |
3,30 |
1,01 |
3,21 |
68,18 |
Soles |
Black-Litterman |
3,29 |
1,54 |
2,10 |
67,74 |
Dollars |
Markowitz |
1,76 |
1,16 |
1,51 |
32,21 |
Dollars |
Black-Litterman |
2,07 |
7,72 |
0,30 |
38,84 |
Integrated |
Markowitz |
2,41 |
0,43 |
5,49 |
46,41 |
Integrated |
Black-Litterman |
2,91 |
1,72 |
1,68 |
58,26 |
Source: Own elaboration.
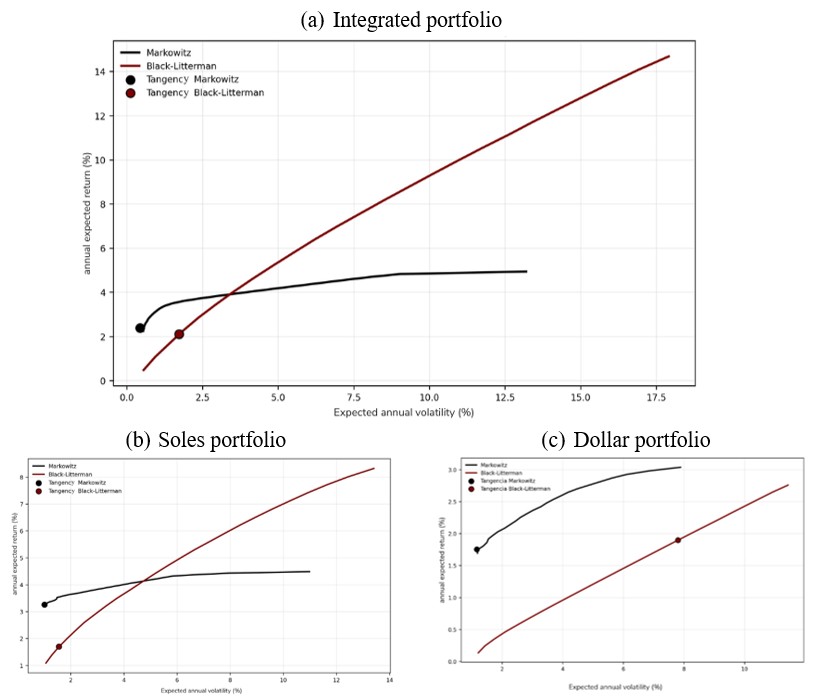
Figure 3 reinforces this reading, where the frontiers of soles-denominated funds are located in a more favorable return zone than those of dollar-denominated funds; the integrated portfolio expands the feasible set; and Black-Litterman shifts the frontier toward portfolios with higher expected return and higher relative risk (for further detail, see Annex 3).
Figure 3
Markowitz and Black-Litterman efficient frontiers
Source: Own elaboration.
Discussions
The results confirm the continued relevance of the mean-variance approach as an efficient allocation tool, in line with Chaweewanchon and Chaysiri (2022), Chen and Zhou (2022), Elavia et al. (2022), and Škrinjarić (2019). However, its performance depends on the currency universe and the constraints applied. In this research, Markowitz generated defensive portfolios, concentrated in low-volatility assets, with high risk-adjusted efficiency.
The evidence also coincides with the critical literature on parametric sensitivity and covariance estimation (Cao & Li, 2023; Hediger & Näf, 2024; Senthilkumar et al., 2022). This warning is relevant because the optimal portfolio can vary if the inputs, constraints, or investment objective change. Therefore, the results should be interpreted as historical efficiency under defined assumptions, not as a universal operational recommendation.
In the case of Black-Litterman, the findings are consistent with Luna and Agudelo (2019), as the incorporation of views allows shifting the portfolio toward segments with greater potential return. However, the cost of that greater accumulation is higher risk exposure, especially in dollars. Thus, Markowitz proves more suitable for conservative profiles, while Black-Litterman is more pertinent for investors willing to accept additional volatility.
In light of the literature on mutual funds and the Peruvian case (Ames, 2012; Castillo & Lama, 1998; Hilario et al., 2020; Pacheco, 2018; Quintana, 2015; Yong, 2011), the main contribution consists of showing that the denomination currency conditions the efficient frontier. Efficiency does not appear as a single outcome, but as a solution dependent on the model, the currency, the fund category, and the decision criterion.
Conclusions
This research compared the Markowitz and Black-Litterman models in Peruvian mutual funds during 2010–2025, differentiating soles-denominated funds, dollar-denominated funds, and an integrated portfolio combining both currencies. The findings show that the denomination currency modifies the risk-return structure, so the efficient frontier should not be interpreted as homogeneous across the entire industry.
Markowitz showed greater consistency in constructing conservative, Sharpe-efficient portfolios, especially in the integrated portfolio. Black-Litterman generated portfolios that were more sensitive to the incorporated views and achieved higher cumulative returns in dollars and in the integrated portfolio, although with greater volatility.
There is no absolute superiority of one model over the other. The choice depends on the decision criterion: risk-adjusted efficiency, for conservative profiles, or the pursuit of greater potential return with market expectations, for profiles with higher risk tolerance.
The future research agenda should assess out-of-sample performance, transaction costs, fees, taxes, liquidity, conversion to a common base currency, and the sensitivity of Black-Litterman parameters, in addition to contrasting these results with robust, Bayesian, or tail-risk models.
Ethical Considerations
This research did not require approval from an Ethics Committee, as it was based on publicly available information, including mutual fund quota value data within this category.
Conflict of Interest
All authors made significant contributions to the document and declare that there is no conflict of interest related to this article.
Author Contribution Statement
Luis Enrique Cayatopa-Rivera: conceptualization, methodology, software, validation, formal analysis, research, writing – original draft, writing: review and editing, visualization.
Carmen Patricia Peralta-Gonzales: conceptualization, research, writing – original draft, validation.
Lily Tatiana León-Echevarría: conceptualization, research, writing – original draft.
Henry Condor-Lucchini: conceptualization, research, writing – original draft.
Source of funding
This research was funded with the researchers’ own resources.
References
(1)Ames, J. (2012). Alternativas de diversificación internacional para portafolios de acciones de la Bolsa de Valores de Lima. Contabilidad y Negocios, 7(13), 13-32. https://doi.org/10.18800/contabilidad.201201.002
(2)Anuno, F., Madaleno, M. & Vieira, E. (2024). Testing of Portfolio Optimization by Timor-Leste Portfolio Investment Strategy on the Stock Market. Journal of Risk and Financial Management, 17(2), 78. https://doi.org/10.3390/jrfm17020078
(3)Barro, D., Basso, A., Funari, S. & Visentin, G. A. (2024). The Effects of the Introduction of Volume-Based Liquidity Constraints in Portfolio Optimization with Alternative Investments. Mathematics, 12(15), e2424. https://doi.org/10.3390/math12152424
(4)Black, F. & Litterman, R. (1992). Global Portfolio Optimization. Financial Analysts Journal, 48(5), 28-43. https://doi.org/10.2469/faj.v48.n5.28
(5)Brown, S. J., Goetzmann, W. N., Ibbotson, R. G. & Ross, S. A. (1992). Survivorship bias in performance studies. The Review of Financial Studies, 5(4), 553-580. https://doi.org/10.1093/rfs/5.4.553
(6)Cao, X. & Li, S. (2023). Neural networks for portfolio analysis with cardinality constraints. IEEE Transactions on Neural Networks and Learning Systems, 35(12), 17674-17687. https://doi.org/10.1109/TNNLS.2023.3307192
(7)Castillo, P. & Lama, R. (1998). Evaluación de portafolio de inversionistas institucionales: fondos mutuos y fondos de pensiones. Banco Central de Reserva del Perú. https://www.bcrp.gob.pe/docs/Publicaciones/Documentos-de-Trabajo/1998/Documento-Trabajo-05-1998.pdf
(8)Cayatopa-Rivera, L. E. & Bendezú-Jiménez, H. J. (2025). Stock market interrelationships in the Latin American Integrated Market (MILA): a VAR approach to short-term dynamics (2015-2022). Tendencias, 26(2), 136-161. https://doi.org/10.22267/rtend.252602.278
(9)Cetingoz, A. R., Fermanian, J. D. & Guéant, O. (2024). Risk budgeting portfolios: existence and computation. Mathematical Finance, 34(3), 896-924. https://doi.org/10.1111/mafi.12419
(10)Chaweewanchon, A. & Chaysiri, R. (2022). Portfolio optimization and rebalancing with transaction cost: A case study in the Stock Exchange of Thailand. In 2022 17th International Joint Symposium on Artificial Intelligence and Natural Language Processing (iSAI-NLP) (pp. 1-6). IEEE. https://doi.org/10.1109/iSAI-NLP56921.2022.9960260
(11)Chen, L. & Zhou, X. Y. (2022). Naive markowitz policies. Mathematical Finance, 34(4), 1167-1196. https://doi.org/10.1111/mafi.12431
(12)Elavia, T., Kothari, S., Li, X. & You, H. (2022). Gains from Markowitz Optimization: Evidence from Reoptimization of Mutual Fund Holdings. The Journal of Portfolio Management, 48(3), 99-218. https://doi.org/10.3905/JPM.2021.1.319
(13)Gubu, L. & Hilmi, M. R. (2024). Beyond Mean-Variance Markowitz Portfolio Selection: A Comparison of Mean-Variance-Skewness-Kurtosis Model and Robust Mean-Variance Model. Economic Computation and Economic Cybernetics Studies and Research, 58(1), 298-313. https://doi.org/10.24818/18423264/58.1.24.19
(14)He, G. & Litterman, R. (2002). The intuition behind Black-Litterman model portfolios. SSRN Electronic Journal. https://doi.org/10.2139/ssrn.334304
(15)Hediger, S. & Näf, J. (2024). Combining the MGHyp distribution with nonlinear shrinkage in modeling financial asset returns. Journal of Empirical Finance, 77, e101489. https://doi.org/10.1016/j.jempfin.2024.101489
(16)Hilario, A., Garcia, A., Salcedo, J. V. & Vercher, M. (2020). Tri-criterion model for constructing low-carbon mutual fund portfolios: a preference-based multi-objective genetic algorithm approach. International Journal of Environmental Research and Public Health, 17(17), 6324. https://doi.org/10.3390/ijerph17176324
(17)Idzorek, T. M. (2007). A step-by-step guide to the Black-Litterman model: Incorporating user-specified confidence levels. Forecasting Expected Returns in the Financial Markets, 17-38. https://doi.org/10.1016/B978-075068321-0.50003-0
(18)Irhamni, F. (2024). Constructing Portfolio Optimization: Analysis in Indonesia Non-Cyclical Industry (Markowitz Approach and Skewness and Kurtosis). Revista de Gestão Social e Ambiental, 18(5), 1-28. https://doi.org/10.24857/rgsa.v18n5-099
(19)Luna, S. & Agudelo, D. A. (2019). ¿Agrega valor el modelo Black-Litterman en portafolios del Mercado Integrado Latinoamericano (MILA)? Evaluación empírica 2008-2016. Revista de Métodos Cuantitativos para la Economía y la Empresa, 27, 55-73. https://doi.org/10.46661/revmetodoscuanteconempresa.2809
(20)Mallieswari, R., Palanisamy, V., Senthilnathan, A. T., Gurumurthy, S., Selvakumar, J. J. & Pachiyappan, S. (2024). A stochastic method for optimizing portfolios using a combined monte carlo and markowitz model: approach on python. Economics. 12(2), 113-127. https://doi.org/10.2478/eoik-2024-0014
(21)Markowitz, H. (1952). Portfolio Selection. The Journal of Finance, 7(1), 77-91. https://doi.org/10.2307/2975974
(22)Nolan, A., Scherer, W. & Burkett, M. (2021). Extending the Markowitz model with dimensionality reduction: Forecasting efficient frontiers. Institute of Electrical and Electronics Engineers. 1-6. https://doi.org/10.1109/SIEDS52267.2021.9483775
(23)Ortiz, R., Contreras, M. & Mellado, C. (2023). Regression, multicollinearity and Markowitz. Finance Research Letters, 58(C), e104550. https://doi.org/10.1016/j.frl.2023.104550
(24)Pacheco, A. (2018). Estrategias de los inversionistas institucionales en el Perú utilizando la teoría de portafolio: el caso de los fondos mutuos 2005-2009. Sciéndo ingenium, 13(2), 115-127. https://revistas.unitru.edu.pe/index.php/PGM/article/view/1866
(25)Puerto, J., Ricca, F., Rodríguez, M. & Scozzari, A. (2022). A combinatorial optimization approach to scenario filtering in portfolio selection. Computers & Operations Research, 142. 105701. https://doi.org/10.1016/j.cor.2022.105701
(26)Quintana, A. (2015). Los fondos mutuos indexados de renta variable como producto alternativo en la industria peruana de fondos mutuos. Contabilidad y Negocios, 10(19), 101-109. https://doi.org/10.18800/contabilidad.201501.006
(27)Reyes, F. J. (2016). Mercado Integrado Latinoamericano (MILA): un análisis de integración financiera y volatilidades. Estocástica: Finanzas y Riesgo, 6(2), 187-218. https://zaloamati.azc.uam.mx/items/7bba33a0-4a5a-4513-aa35-85c13121ad18
(28)Sadik, S., Et-Tolba, M. & Nsiri, B. (2024). A Modified Adaptive Sparse-Group LASSO Regularization for Optimal Portfolio Selection. Institute of Electrical and Electronics Engineers, 12, 107337-107352. https://ieeexplore.ieee.org/document/10623175
(29)Senthilkumar, A., Namboothiri, A. & Rajeev, S. (2022). Does portfolio optimization favor sector or broad market investments? Journal of Public Affairs, 22(S1), e2752. https://doi.org/10.1002/pa.2752
(30)Sharpe, W. F. (1966). Mutual Fund Performance. The Journal of Business, 39(1), 119-138. https://doi.org/10.1086/294846
(31)Sharpe, W. F. (1994). The Sharpe ratio. The Journal of Portfolio Management, 21(1), 49-58. https://doi.org/10.3905/jpm.1994.409501
(32)Škrinjarić, T. (2019). Performance Gauging of Portfolio: Luenberger Distance Function Approach on Sarajevo Stock Exchange. South East European Journal of Economics and Business, 14(1), 92-100. https://doi.org/10.2478/jeb-2019-0007
(33)Superintendencia del Mercado de Valores (SMV). (2021). Fondos mutuos. https://www.smv.gob.pe/uploads/FondosMutuos.pdf
(34)Urdaneta, A., Segarra, H. & Orellana, F. (2021). Comportamiento de los índices bursátiles de las economías mundiales en el marco de la pandemia de Covid-19. Dominio de las Ciencias, 7(1), 725-750. https://dominiodelasciencias.com/ojs/index.php/es/article/view/1736
(35)Yong, A. (2011). ¿Vencen al mercado? El caso de los fondos mutuos de renta fija en el mercado peruano. Journal of Business, 3(2), 16-37. https://doi.org/10.21678/jb.2011.49
Annexs
Annexs 1
List of prioritized mutual funds. 2010-2025. (n=31)
Mutual Fund |
SMV Classification |
Category |
Manager |
Quota Currency |
BBVA CASH DOLLARS |
Short –Term Debt Inst. $ |
Fixed income |
BBVA SAF |
$ |
BBVA CASH SOLES |
Short –Term Debt Inst. S/ |
Fixed income |
BBVA SAF |
S/ |
BBVA RENTA CORTO PLAZO $ |
Short –Term Debt Inst.$ |
Fixed income |
BBVA SAF |
$ |
BBVA RENTA CORTO PLAZO S/. |
Short –Term Debt Inst. S/ |
Fixed income |
BBVA SAF |
S/ |
BBVA RENTA MED. PLAZO $ |
Medium-Term Debt Inst. $ |
Fixed income |
BBVA SAF |
$ |
BBVA RENTA MED. PLAZO S/. |
Medium-Term Debt Inst. S/ |
Fixed income |
BBVA SAF |
S/ |
CC CONSERV. MED. PLAZO S/. |
Medium-Term Debt Inst. S/ |
Fixed income |
CREDICORP SAF |
S/ |
CRED. CONSERVAD. LIQUIDEZ S/ |
Short –Term Debt Inst. |
Fixed income |
CREDICORP SAF |
S/ |
CRED. CONSERVADOR LIQUIDEZ $ |
Short –Term Debt Inst.$ |
Fixed income |
CREDICORP SAF |
$ |
IF MEDIANO PLAZO |
Medium-Term Debt Inst. $ |
Fixed income |
INTERFONDO |
$ |
IF MEDIANO PLAZO SOLES |
Medium-Term Debt Inst. S/ |
Fixed income |
INTERFONDO |
S/ |
CRED. CRECIMIENTO VCS |
Mixed Income Growth Soles |
Mixed income |
CREDICORP SAF |
S/ |
CRED. EQUILIBRADO |
Mixed Income Moderate Dollars |
Mixed income |
CREDICORP SAF |
$ |
CRED. EQUILIBRADO VCS |
Fund of Funds |
Mixed income |
CREDICORP SAF |
S/ |
CRED. MODERADO |
Mixed Income Moderate Dollars |
Mixed income |
CREDICORP SAF |
$ |
CRED. MODERADO VCS |
Mixed Income Growth Soles |
Mixed income |
CREDICORP SAF |
S/ |
CREDICORP CONSER. MED. PLA. $ |
Fund of Funds |
Mixed income |
CREDICORP SAF |
$ |
FdF BBVA CONSERV GLO $ |
Fund of Funds |
Mixed income |
BBVA SAF |
$ |
FdF BBVA CONSERV GLO S/ |
Fund of Funds |
Mixed income |
BBVA SAF |
S/ |
FdF BBVA DINAMICO GLOBAL S/ |
Fund of Funds |
Mixed income |
BBVA SAF |
S/ |
FdF BBVA Equilibrado Global S/ |
Fund of Funds |
Mixed income |
BBVA SAF |
S/ |
IF INVERSION FLEXIBLE |
Flexible |
Mixed income |
INTERFONDO |
S/ |
IF MIXTO BALANCEADO |
Mixed Income Balanced Dollars |
Mixed income |
INTERFONDO |
$ |
SCOTIA FONDO CASH $ |
Flexible |
Mixed income |
SCOTIA FONDOS |
$ |
SCOTIA FONDO CASH S/. |
Flexible |
Mixed income |
SCOTIA FONDOS |
S/ |
SCOTIA FONDO PREMIUM $ |
Flexible |
Mixed income |
SCOTIA FONDOS |
$ |
SCOTIA FONDO PREMIUM S/. |
Flexible |
Mixed income |
SCOTIA FONDOS |
S/ |
CREDICORP CAPITAL ACCIONES |
Equity income |
Equity income |
CREDICORP SAF |
$ |
IF ACCIONES |
Equity income |
Equity income |
INTERFONDO |
S/ |
Promoinvest Fondo Selectivo |
Equity income |
Equity income |
PROMOINVEST SAF |
$ |
SURA ACCIONES |
Equity income |
Equity income |
FONDOS SURA SAF |
S/ |
Source: Own elaboration.
Annex 2
Prioritized mutual funds. Descriptive statistics. 2010-2025. (n=31)
Mutual fund |
Category |
Avg. Monthly return |
Monthly vol. |
Avg. Annual return (%) |
Annual vol. (%) |
Sharpe |
Cumulative return (%) |
CC CONSERV, MED, PLAZO S/ |
Fixed income |
0,0035 |
0,0056 |
4,1590 |
1,9394 |
2,1445 |
93,7340 |
BBVA RENTA MED, PLAZO S/ |
Fixed income |
0,0030 |
0,0061 |
3,6096 |
2,1139 |
1,7076 |
77,3814 |
CRED, CONSERVAD, LIQUIDEZ S/ |
Fixed income |
0,0029 |
0,0014 |
3,4216 |
0,4855 |
7,0481 |
72,7186 |
BBVA RENTA CORTO PLAZO S/ |
Fixed income |
0,0028 |
0,0024 |
3,3145 |
0,8396 |
3,9477 |
69,7291 |
IF MEDIANO PLAZO SOLES |
Fixed income |
0,0026 |
0,0064 |
3,1198 |
2,2295 |
1,3994 |
63,9781 |
BBVA CASH SOLES |
Fixed income |
0,0025 |
0,0014 |
3,0477 |
0,5014 |
6,0781 |
62,7128 |
BBVA RENTA MED, PLAZO $ |
Fixed income |
0,0016 |
0,0071 |
1,9591 |
2,4511 |
0,7992 |
36,1231 |
IF MEDIANO PLAZO |
Fixed income |
0,0015 |
0,0088 |
1,8471 |
3,0416 |
0,6073 |
33,3447 |
BBVA RENTA CORTO PLAZO $ |
Fixed income |
0,0013 |
0,0019 |
1,6192 |
0,6596 |
2,4548 |
29,5064 |
CRED, CONSERVADOR LIQUIDEZ $ |
Fixed income |
0,0013 |
0,0013 |
1,6097 |
0,4479 |
3,5934 |
29,3321 |
BBVA CASH DOLARES |
Fixed income |
0,0012 |
0,0013 |
1,4328 |
0,4457 |
3,2144 |
25,7283 |
CRED, CRECIMIENTO VCS |
Mixed income |
0,0046 |
0,0426 |
5,4833 |
14,7452 |
0,3719 |
102,0605 |
FdF BBVA DINAMICO GLOBAL S/ |
Mixed income |
0,0033 |
0,0493 |
3,9674 |
17,0849 |
0,2322 |
49,5893 |
IF INVERSION FLEXIBLE |
Mixed income |
0,0031 |
0,0133 |
3,7570 |
4,5930 |
0,8180 |
79,2242 |
CRED, MODERADO VCS |
Mixed income |
0,0028 |
0,0153 |
3,4063 |
5,3033 |
0,6423 |
68,5300 |
CRED, EQUILIBRADO |
Mixed income |
0,0027 |
0,0333 |
3,2415 |
11,5239 |
0,2813 |
50,9660 |
FdF BBVA Equilibrado Global S/ |
Mixed income |
0,0026 |
0,0255 |
3,0713 |
8,8506 |
0,3470 |
53,5335 |
IF MIXTO BALANCEADO |
Mixed income |
0,0021 |
0,0314 |
2,4906 |
10,8702 |
0,2291 |
35,5605 |
CREDICORP CONSER, MED, PLA, $ |
Mixed income |
0,0020 |
0,0078 |
2,4194 |
2,7157 |
0,8909 |
46,3386 |
FdF BBVA CONSERV GLO S/ |
Mixed income |
0,0020 |
0,0135 |
2,4001 |
4,6743 |
0,5135 |
44,2380 |
FdF BBVA CONSERV GLO $ |
Mixed income |
0,0018 |
0,0075 |
2,2021 |
2,5878 |
0,8510 |
41,4350 |
SCOTIA FONDO CASH S/ |
Mixed income |
0,0017 |
0,0041 |
2,0093 |
1,4299 |
1,4052 |
37,6555 |
CRED, MODERADO |
Mixed income |
0,0016 |
0,0189 |
1,8829 |
6,5360 |
0,2881 |
30,5606 |
CRED, EQUILIBRADO VCS |
Mixed income |
0,0012 |
0,0286 |
1,4561 |
9,8973 |
0,1471 |
16,7499 |
SCOTIA FONDO CASH $ |
Mixed income |
0,0009 |
0,0029 |
1,0971 |
1,0141 |
1,0819 |
19,0823 |
SCOTIA FONDO PREMIUM S/ |
Mixed income |
0,0003 |
0,0141 |
0,3083 |
4,8997 |
0,0629 |
3,0032 |
SCOTIA FONDO PREMIUM $ |
Mixed income |
0,0000 |
0,0138 |
-0,0592 |
4,7848 |
-0,0124 |
-2,7403 |
CREDICORP CAPITAL ACCIONES |
Equity income |
0,0056 |
0,0637 |
6,6847 |
22,0627 |
0,3030 |
98,0354 |
SURA ACCIONES |
Equity income |
0,0053 |
0,0578 |
6,3725 |
20,0388 |
0,3180 |
101,0651 |
IF ACCIONES |
Equity income |
0,0031 |
0,0525 |
3,7519 |
18,1931 |
0,2062 |
39,8228 |
Promoinvest Fondo Selectivo |
Equity income |
0,0014 |
0,0681 |
1,7156 |
23,5842 |
0,0727 |
-15,2900 |
Source: Own elaboration.
Annex 3
Efficient frontiers resulting from the research. Descriptive portfolio results.
Markowitz Model |
Black-Litterman Model |
||||
Expected annual return (%) |
Expected annual volatility (%) |
Expected Sharpe |
Expected annual return (%) |
Expected annual volatility (%) |
Expected Sharpe |
2,2455 |
0,5407 |
4,1526 |
0,4765 |
0,5535 |
0,8609 |
2,3577 |
0,5499 |
4,2875 |
1,0686 |
0,9349 |
1,1429 |
2,4699 |
0,5755 |
4,2917 |
1,6606 |
1,3927 |
1,1923 |
2,5822 |
0,6151 |
4,1978 |
2,2526 |
1,8533 |
1,2155 |
2,6944 |
0,6677 |
4,0351 |
2,8447 |
2,3626 |
1,2040 |
2,8066 |
0,7153 |
3,9237 |
3,4367 |
2,9324 |
1,1720 |
2,9188 |
0,7878 |
3,7048 |
4,0288 |
3,5311 |
1,1409 |
3,0310 |
0,8709 |
3,4803 |
4,6208 |
4,1692 |
1,1083 |
3,1433 |
0,9699 |
3,2410 |
5,2128 |
4,8369 |
1,0777 |
3,2555 |
1,0749 |
3,0287 |
5,8049 |
5,5220 |
1,0512 |
3,3677 |
1,2221 |
2,7556 |
6,3969 |
6,2166 |
1,0290 |
3,4799 |
1,4590 |
2,3852 |
6,9889 |
6,9588 |
1,0043 |
3,5921 |
1,8172 |
1,9767 |
7,5810 |
7,7320 |
0,9805 |
3,7044 |
2,3281 |
1,5912 |
8,1730 |
8,5064 |
0,9608 |
3,8166 |
2,9145 |
1,3095 |
8,7650 |
9,3075 |
0,9417 |
3,9288 |
3,5324 |
1,1122 |
9,3571 |
10,1094 |
0,9256 |
4,0410 |
4,1726 |
0,9685 |
9,9491 |
10,9234 |
0,9108 |
4,1532 |
4,8252 |
0,8607 |
10,5412 |
11,7528 |
0,8969 |
4,2655 |
5,4785 |
0,7786 |
11,1332 |
12,6149 |
0,8825 |
4,3777 |
6,1380 |
0,7132 |
11,7252 |
13,4335 |
0,8728 |
4,4899 |
6,8017 |
0,6601 |
12,3173 |
14,2916 |
0,8619 |
4,6021 |
7,4820 |
0,6151 |
12,9093 |
15,1561 |
0,8518 |
4,7143 |
8,1988 |
0,5750 |
13,5013 |
16,0317 |
0,8422 |
4,8266 |
9,0363 |
0,5341 |
14,0934 |
16,9328 |
0,8323 |
4,9388 |
13,1980 |
0,3742 |
14,6854 |
17,9133 |
0,8198 |
Markowitz Model |
Black-Litterman Model |
||||
Expected annual return (%) |
Expected annual volatility (%) |
Expected Sharpe |
Expected annual return (%) |
Expected annual volatility (%) |
Expected Sharpe |
3,2037 |
1,0744 |
2,9818 |
1,0873 |
1,0653 |
1,0206 |
3,2571 |
1,0520 |
3,0961 |
1,3887 |
1,2910 |
1,0757 |
3,3105 |
1,0801 |
3,0650 |
1,6901 |
1,5551 |
1,0868 |
3,3638 |
1,2115 |
2,7766 |
1,9915 |
1,8552 |
1,0735 |
3,4172 |
1,3876 |
2,4628 |
2,2929 |
2,1753 |
1,0541 |
3,4706 |
1,4727 |
2,3565 |
2,5943 |
2,5056 |
1,0354 |
3,5239 |
1,4848 |
2,3733 |
2,8958 |
2,9069 |
0,9962 |
3,5773 |
1,6943 |
2,1113 |
3,1972 |
3,3106 |
0,9657 |
3,6307 |
1,9265 |
1,8846 |
3,4986 |
3,7422 |
0,9349 |
3,6841 |
2,2639 |
1,6273 |
3,8000 |
4,2249 |
0,8994 |
3,7374 |
2,5317 |
1,4762 |
4,1014 |
4,6836 |
0,8757 |
3,7908 |
2,8044 |
1,3517 |
4,4028 |
5,1550 |
0,8541 |
3,8442 |
3,0959 |
1,2417 |
4,7042 |
5,6428 |
0,8337 |
3,8975 |
3,3896 |
1,1499 |
5,0056 |
6,1513 |
0,8138 |
3,9509 |
3,6878 |
1,0713 |
5,3071 |
6,6704 |
0,7956 |
4,0043 |
3,9902 |
1,0035 |
5,6085 |
7,2367 |
0,7750 |
4,0577 |
4,2668 |
0,9510 |
5,9099 |
7,7952 |
0,7581 |
4,1110 |
4,6101 |
0,8917 |
6,2113 |
8,3631 |
0,7427 |
4,1644 |
4,8941 |
0,8509 |
6,5127 |
8,9651 |
0,7265 |
4,2178 |
5,2371 |
0,8054 |
6,8141 |
9,5893 |
0,7106 |
4,2711 |
5,5242 |
0,7732 |
7,1155 |
10,2460 |
0,6945 |
4,3245 |
5,8614 |
0,7378 |
7,4170 |
10,9214 |
0,6791 |
4,3779 |
6,7974 |
0,6441 |
7,7184 |
11,6517 |
0,6624 |
4,4313 |
8,0010 |
0,5538 |
8,0198 |
12,4668 |
0,6433 |
4,4846 |
10,9855 |
0,4082 |
8,3212 |
13,4091 |
0,6206 |
Markowitz Model |
Black-Litterman Model |
||||
Expected annual return (%) |
Expected annual volatility (%) |
Expected Sharpe |
Expected annual return (%) |
Expected annual volatility (%) |
Expected Sharpe |
1,6927 |
1,1876 |
1,4253 |
0,1344 |
1,2127 |
0,1109 |
1,7488 |
1,1929 |
1,4660 |
0,2438 |
1,4341 |
0,1700 |
1,8048 |
1,3766 |
1,3110 |
0,3531 |
1,7517 |
0,2016 |
1,8609 |
1,4981 |
1,2421 |
0,4625 |
2,1033 |
0,2199 |
1,9169 |
1,5476 |
1,2387 |
0,5719 |
2,5063 |
0,2282 |
1,9730 |
1,6979 |
1,1620 |
0,6812 |
2,9184 |
0,2334 |
2,0290 |
1,8605 |
1,0906 |
0,7906 |
3,3384 |
0,2368 |
2,0851 |
2,0857 |
0,9997 |
0,8999 |
3,7676 |
0,2389 |
2,1411 |
2,2665 |
0,9447 |
1,0093 |
4,2048 |
0,2400 |
2,1972 |
2,4485 |
0,8974 |
1,1186 |
4,6434 |
0,2409 |
2,2532 |
2,6027 |
0,8657 |
1,2280 |
5,0815 |
0,2417 |
2,3093 |
2,8102 |
0,8217 |
1,3373 |
5,5244 |
0,2421 |
2,3653 |
3,0233 |
0,7824 |
1,4467 |
5,9657 |
0,2425 |
2,4214 |
3,2802 |
0,7382 |
1,5560 |
6,4098 |
0,2428 |
2,4774 |
3,4622 |
0,7156 |
1,6654 |
6,8548 |
0,2430 |
2,5335 |
3,6856 |
0,6874 |
1,7747 |
7,3014 |
0,2431 |
2,5895 |
3,9341 |
0,6582 |
1,8841 |
7,7493 |
0,2431 |
2,6456 |
4,1721 |
0,6341 |
1,9934 |
8,1996 |
0,2431 |
2,7016 |
4,4839 |
0,6025 |
2,1028 |
8,6532 |
0,2430 |
2,7577 |
4,8654 |
0,5668 |
2,2122 |
9,1112 |
0,2428 |
2,8137 |
5,2482 |
0,5361 |
2,3215 |
9,5580 |
0,2429 |
2,8698 |
5,6335 |
0,5094 |
2,4309 |
10,0121 |
0,2428 |
2,9258 |
6,1108 |
0,4788 |
2,5402 |
10,4681 |
0,2427 |
2,9819 |
6,8628 |
0,4345 |
2,6496 |
10,9278 |
0,2425 |
3,0379 |
7,8898 |
0,3850 |
2,7589 |
11,4364 |
0,2412 |
Source: Own elaboration.