https://doi.org/10.22267/rtend.26272.304
Review article
Urban planning and economics
Territorial gaps and urban sustainability in Aguachica, Cesar, Colombia
Brechas territoriales y sostenibilidad urbana en Aguachica, Cesar, Colombia
Lacunas territoriais e sustentabilidade urbana em Aguachica, Cesar, Colombia
By: Genjis Alberto Ossa González 1
1
1Master of Science in Data Science, Pontificia Universidad Javeriana. Professor at Universidad Popular del Cesar. ORCID: 0000-0002-8194-0859. E-mail: gossa@unicesar.edu.co, Aguachica - Colombia.
Received: November 24, 2025 Accepted: May 30, 2026
DOI: https://doi.org/10.22267/rtend.26272.304
How to cite this article: Ossa, G. (2026). Territorial gaps and urban sustainability in Aguachica, Cesar. Tendencias, 27(2), 263-291. https://doi.org/10.22267/rtend.26272.304

Abstract
Introduction: This article analyzes the socioeconomic and environmental gaps of the municipality of Aguachica, located in the department of Cesar, Colombia, with the purpose of understanding the factors that shape its territorial development. Objective: To identify the main territorial gaps based on educational, social, economic, urban, and environmental variables. Methodology: From a quantitative, descriptive, and longitudinal approach, official data on education, health, housing, public services, municipal value added, energy demand, land cover, forest loss, and surface temperature were integrated, complemented with geospatial information processed through Google Earth Engine and QGIS. Results: Progressive loss of educational coverage at higher levels is evident, along with relative stagnation in State Exams scores, urban-rural gaps in water supply, sewage, and natural gas, and high economic concentration in the tertiary sector. Additionally, environmental pressures are identified, associated with loss of tree cover, agricultural dominance of land use, and rising average temperatures between 2022 and 2024. Discussion: The findings engage with human capital, territorial development, and sustainability approaches, showing that social, productive, and environmental gaps mutually reinforce one another. Conclusion: Aguachica requires evidence-based public planning aimed at reducing gaps, diversifying its economy, and strengthening environmental management.
Keywords: climate change; school dropout; economy; productivity; energy resources.
JEL: I24; I25; O18; R11; R58.
Resumen
Introducción: El artículo analiza las brechas socioeconómicas y ambientales del municipio de Aguachica, ubicado en el departamento del Cesar, Colombia, con el propósito de comprender los factores que condicionan su desarrollo territorial. Objetivo: Identificar las principales brechas territoriales a partir de variables educativas, sociales, económicas, urbanas y ambientales. Metodología: Desde un enfoque cuantitativo, descriptivo y longitudinal, se integraron datos oficiales de educación, salud, vivienda, servicios públicos, valor agregado municipal, demanda energética, cobertura del suelo, pérdida forestal y temperatura superficial, complementados con información geoespacial procesada mediante Google Earth Engine y QGIS. Resultados: Se evidencia pérdida progresiva de cobertura educativa en los niveles superiores, estancamiento relativo en los puntajes de las Pruebas Saber, brechas urbano-rurales en acueducto, alcantarillado y gas natural, y alta concentración económica en el sector terciario. Además, se identifican presiones ambientales asociadas a la pérdida de cobertura arbórea, predominio agropecuario del suelo y aumento de la temperatura media entre 2022 y 2024. Discusión: Los hallazgos dialogan con enfoques de capital humano, desarrollo territorial y sostenibilidad, evidenciando que las brechas sociales, productivas y ambientales se refuerzan mutuamente. Conclusión: Aguachica requiere planificación pública basada en evidencia, orientada a reducir brechas, diversificar su economía y fortalecer la gestión ambiental.
Palabras clave: cambio climático; deserción escolar; economía; productividad; recursos energéticos.
JEL: I24; I25; O18; R11; R58.
Resumo
Introdução: O artigo analisa as disparidades socioeconómicas e ambientais do município de Aguachica, situado no departamento de Cesar, na Colômbia, com o objetivo de compreender os fatores que condicionam o seu desenvolvimento territorial. Objetivo: Identificar as principais disparidades territoriais com base em variáveis educativas, sociais, económicas, urbanas e ambientais. Metodologia: A partir de uma abordagem quantitativa, descritiva e longitudinal, foram integrados dados oficiais sobre educação, saúde, habitação, serviços públicos, valor acrescentado municipal, procura energética, cobertura do solo, perda florestal e temperatura superficial, complementados com informação geoespacial processada através do Google Earth Engine e do QGIS. Resultados: Verifica-se uma perda progressiva da cobertura educativa nos níveis superiores, uma estagnação relativa nas pontuações dos exames Saber, disparidades entre as zonas urbanas e rurais no que diz respeito ao abastecimento de água, esgotos e gás natural, e uma elevada concentração económica no setor terciário. Além disso, identificam-se pressões ambientais associadas à perda de cobertura arbórea, ao predomínio da agricultura e da pecuária na utilização do solo e ao aumento da temperatura média entre 2022 e 2024. Discussão: Os resultados dialogam com abordagens de capital humano, desenvolvimento territorial e sustentabilidade, evidenciando que as disparidades sociais, produtivas e ambientais se reforçam mutuamente. Conclusão: Aguachica necessita de um planeamento público baseado em evidências, orientado para a redução das disparidades, , diversificar a sua economia e reforçar a gestão ambiental.
Palavras-chave: alterações climáticas; abandono escolar; economia; produtividade; recursos energéticos.
JEL: I24; I25; O18; R11; R58.
Introduction
Aguachica is the second most important urban center in the department of Cesar and plays a strategic role as an articulating node between the Caribbean region and the interior of Colombia. According to the Ministry of Transport (2023), the municipality received cargo from 319 geographic origins, second only to Valledupar, with 386. According to population projections from the National Administrative Department of Statistics (DANE, 2025), this territory has 130,258 inhabitants, which poses significant challenges for the local government in guaranteeing coverage in education, health, and basic services, as well as managing urban expansion without compromising the environmental surroundings.
The central purpose of this study is to analyze, from an integrated territorial perspective, the main socioeconomic and environmental gaps in Aguachica, with emphasis on educational coverage, access to basic services, economic structure, energy demand, land use, forest loss, and temperature trends. In the educational component, Tinto's (1975) theory of school dropout posits that abandonment is not solely due to economic factors, but also to the lack of academic and social integration of the student. This perspective has been widely applied in Latin America to explain the enrollment gaps between primary, secondary, and upper secondary education, where vulnerable environments and limited institutional support contribute to dropout (Espinosa & León, 2002). Added to this are structural factors such as poverty, rurality, the need to work, and deficiencies in the educational system, which act as exogenous causes that hinder the school trajectory, especially in non-metropolitan regions (Roman, 2013).
Moreover, the link between schooling and development has been problematized by authors such as Pritchett (2001), who explains that an increase in years of study does not always translate into higher levels of productivity or well-being, especially if the educational system is of low quality or the labor market does not absorb the trained human capital.
This idea is reinforced by Ocampo (2002), who warns that in order to overcome the “low-growth trap” in Latin America, it is necessary to improve retention at higher educational levels, particularly in upper secondary education, in order to generate real productive capacities in the young population.
From the Latin American structuralist school of thought, particularly that developed by the Economic Commission for Latin America and the Caribbean (ECLAC), it has been argued that underdevelopment in the region is not a prior stage of development, but rather a structural condition characterized by technological, commercial, and financial dependence on core countries (Pereira et al., 2023). At the energy level, the relationship between consumption and economic growth has been documented in various regional studies. Stern and Common (2001) note that in non-OECD (Organization for Economic Co-operation and Development) countries, there is a positive correlation between income and emissions derived from energy use. This claim is supported by Barreto and Campo (2012), who, through panel analysis for Latin America, conclude that a 1% increase in energy consumption can generate a 0.4% growth in GDP over the long term. However, this energy dependency also represents a source of structural vulnerability for the region.
For this reason, authors such as Toledo and Chamba (2024) advocate for a transition toward knowledge-intensive sectors and sustainable energy policies that can balance development with environmental protection.
The environmental component of development cannot be ignored, and in this regard the Environmental Kuznets Curve (EKC) posits that environmental degradation increases with economic growth up to a certain threshold, after which it begins to decline as a result of higher incomes, environmental regulation, and clean technologies (Seri & de Juan, 2021). Finally, the vulnerability of the local economy to the effects of climate change, rising surface temperatures, and forest loss is reinforced if progress is not made toward a production matrix less dependent on natural resources.
Methodology
The research adopts a quantitative, descriptive, and non-experimental approach, with temporal analysis of indicator series available for different periods, aimed at observing variables of the municipality of Aguachica, Cesar, based on census, administrative, and satellite data (Table 1). The base year 2018 was used as a temporal reference, complemented with dynamic data from the 2022–2024 period. The unit of analysis corresponds to the municipality and its official spatial boundaries; since complete coverage data were used, no sampling was applied.
Table 1
Variables
Component |
Dimension |
Education |
Educational coverage |
Education |
Academic performance |
Health |
Health coverage |
Demographics |
Birth rate |
Housing |
Housing deficit |
Public services |
Access to services |
Economy |
Productive structure |
Energy |
Energy demand |
Environment |
Forest coverage |
Environment |
Temperature |
Environment |
Land use |
Source: Own elaboration.
The processing and analysis of satellite data were carried out using Google Earth Engine (GEE) and QGIS. For the estimation of land surface temperature, the MODIS Terra MOD11A1 version 6.1 product was used, which provides daily values of surface temperature and emissivity with a spatial resolution of 1 km. The analysis of tree cover was performed using the global Tree Cover 2010 product, derived from annual compositions of Landsat 7 ETM+ imagery, which estimates the maximum percentage of canopy cover per pixel (1–100%) through regression models and multi-year smoothing techniques to reduce noise and data gaps.
The selection of images and satellite products was based on criteria of complete spatial coverage of the study area. Subsequently, the results were clipped and spatially analyzed in QGIS, using vector layers and .TIFF files for cartographic representation and descriptive analysis. It is acknowledged that variables derived from remote sensors correspond to estimates subject to uncertainty associated with spatial resolution; therefore, the results are interpreted in terms of spatial patterns and relative trends, and not as exact field measurements.
Results
The results are presented through an integrated reading of the educational, social, urban, economic, energy, and environmental dimensions of the municipality of Aguachica. This organization makes it possible to identify differentiated territorial patterns and establish a diagnostic baseline on the main gaps affecting local development.
Education
In the initial phase of the results, the educational coverage for the year 2022 was analyzed, the values of which are indicated in Figure 1.
Figure 1
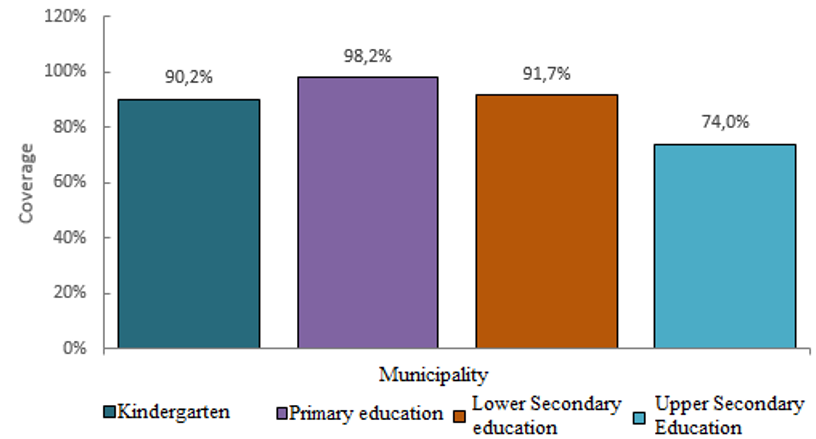
Educational coverage (2022)
Source: Own elaboration based on data from MinEducación (2024).
In basic education, which consists of nine grades distributed in two cycles primary with five grades and secondary with four plus upper secondary education covering tenth and eleventh grade, a reduction in coverage is observed as students advance to higher educational levels. Coverage in preschool transition reaches 90.2%, increases to 98.2% in primary, and stands at 91.7% in secondary, which could reflect the presence of students who have failed or dropped out.
According to Pritchett (2001), schooling alone does not guarantee economic development. His research shows that, in contexts where educational quality is low or the labor market does not absorb skilled workers, an increase in years of study does not necessarily increase productivity. In extreme cases, it can even be associated with stagnation if young people leave education before acquiring competencies useful for their professional performance. According to Ocampo (2002), in Latin America it is emphasized that improving school retention, especially at the upper secondary level, is a condition for escaping the “low-growth trap”, as the region combines technological lag with persistent educational gaps.
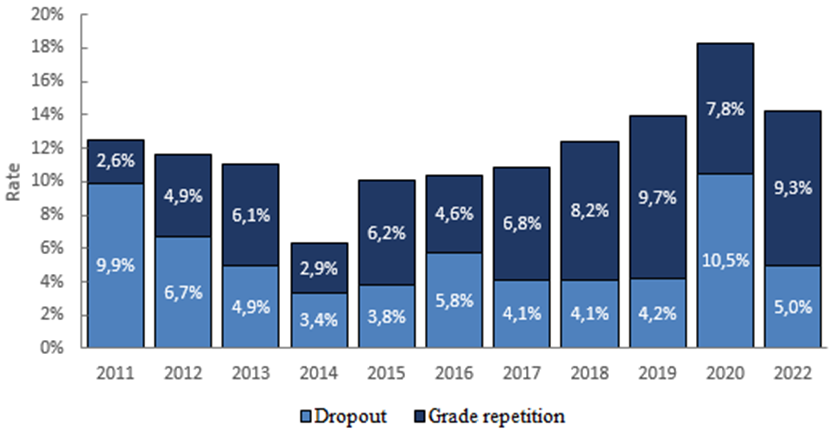
Figure 2 illustrates the historical behavior of dropout and failure rates from 2011 to 2022.
Figure 2
Dropout and failure rates
Source: Own elaboration based on data from MinEducación (2024).
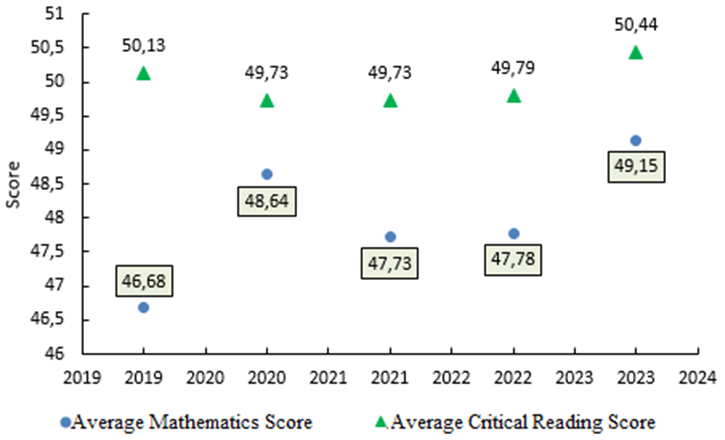
Figure 3 presents the average results of the State Exams in the areas of mathematics and critical reading. In mathematics, the average increased from 46.68 to 49.15 during the analyzed period, showing a moderate improvement. This behavior was marked by an initial increase between 2019 and 2020, followed by minor variations in subsequent years. For its part, critical reading results remained practically stable, with values oscillating between 49.73 and 50.44, suggesting sustained performance, albeit without significant advances.
Figure 3
Average State Exams scores by subject area
Source: Own elaboration based on data from TerriData (2025b).
Health and social protection
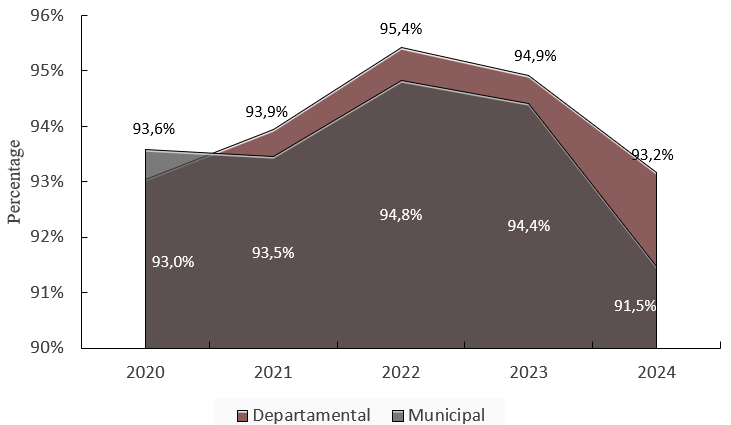
In this phase of the results, the health component is analyzed. To this end, Figure 4 presents the percentage health coverage at the departmental and municipal levels, allowing comparison of the behavior of this indicator between Aguachica and the department of Cesar.
Figure 4
Health coverage at the departmental and municipal level
Source: Own elaboration based on data from the Ministry on Health (2025).
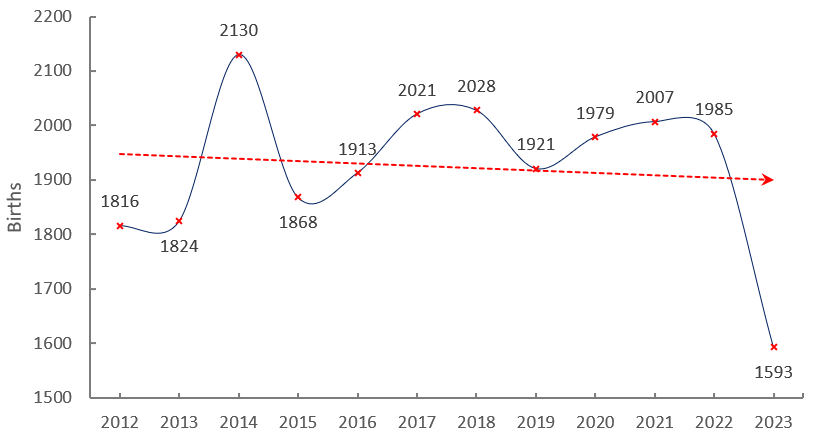
When comparing health coverage in Aguachica with that of the department of Cesar, it is observed that, with the exception of 2020, the municipality presented coverage levels slightly below the departmental average. Although the percentage difference is small, recent behavior shows a declining trend, as municipal coverage decreased by 3.3 percentage points between 2022 and 2024. In this context, and as a complement to the analysis of the Health and Social Protection component, Figure 5 presents the evolution of live births during the 2012–2023 period.
Figure 5
Live births (2012-2023)
Source: Own elaboration based on data from DANE (2025).
There is a declining trend in live births in the municipality of Aguachica, with an annual average of -0.76%, which becomes even more pronounced after 2021, as it may be associated with post-pandemic demographic changes; however, this relationship requires additional evidence.
Housing, city and territory
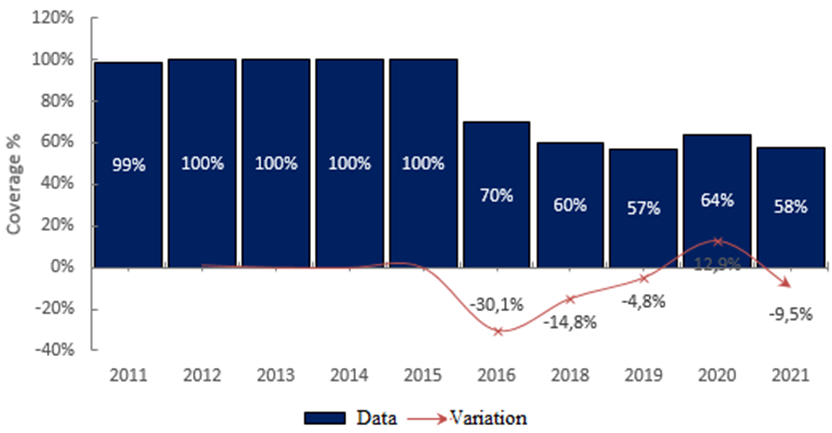
From a territorial coverage perspective, it would be expected that this would remain stable or even increase, given that the population is constant, or that, due to demographic dynamics, a displacement toward urban centers would occur. However, since 2015, electrical coverage in these areas has shown a significant decline. This suggests that, during this period, the rural area of the municipality has experienced an increase in dispersed settlements (Figure 6).
Figure 6
Rural electricity coverage
Source: Own elaboration based on data from TerriData (2025a).
Table 2 presents the occupied dwellings according to the availability of services.
Table 2
Occupied dwellings with residents present by service availability
Zone |
Total |
Aqueduct |
Sewage |
Natural gas |
Urban center |
24565 |
95,50% |
89,84% |
82,90% |
Rural populated center |
1370 |
97,37% |
8,83% |
1,97% |
Dispersed rural |
1855 |
28,63% |
3,50% |
2,48% |
Total |
27790 |
91,13% |
80,08% |
73,54% |
Source: Own elaboration based on data from DANE (2018).
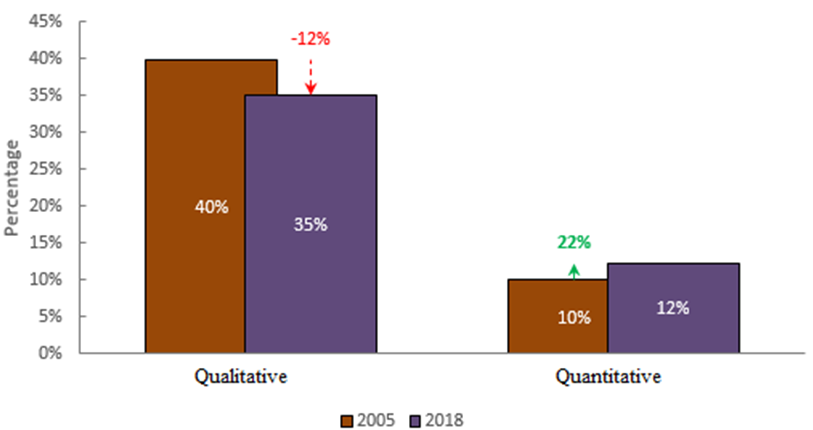
Urban areas concentrate the vast majority of households and show values above 80% for all three services, suggesting relatively consolidated infrastructure. In rural populated centers, a relevant contrast is identified: aqueduct coverage reaches 97%, but sewage is only 8.83% and natural gas 1.97%. In the dispersed rural areas, the situation is more complex; less than a third has access to water through the network, and barely 3.5% have sewage and 2.4% natural gas. Figure 7 shows the qualitative and quantitative housing deficit recorded in the 2005 and 2018 censuses.
Figure 7
Qualitative and quantitative housing deficit in the censuses
Source: Own elaboration based on data from TerriData (2025a).
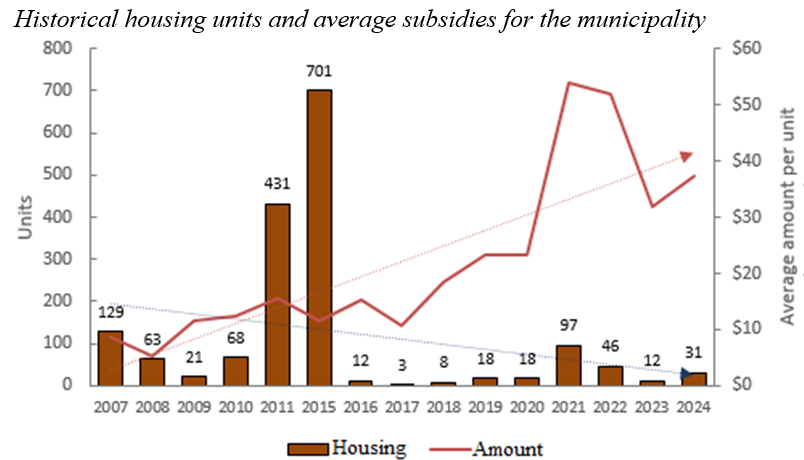
Between 2005 and 2018, Aguachica managed to reduce the qualitative deficit, indicating improvements in housing quality and basic services infrastructure. However, the quantitative deficit increased from 10% to 12%, equivalent to 2 percentage points, implying that the supply of new housing has not been sufficient to meet demand. Next, Figure 8 presents the historical record of housing units and the average subsidies granted.
Figure 8
Historical housing units and average subsidies for the municipality
Source: Own elaboration based on data from the Ministry of Housing, City, and Territory (2025).
Housing construction shows evident volatility over time. Significant peaks are observed in 2011, with 431 units, and in 2015, with 701, followed by a decline starting in 2016. In recent years, a slight recovery is recorded, although without reaching the levels observed in 2011 and 2015. On the other hand, while the number of subsidized housing units has decreased, the average value of these subsidies shows an upward trend. Consequently, this could indicate an increase in the costs associated with acquiring subsidized housing; however, additional information on market prices is required.
Mining and energy
According to Stern and Common (2001), the relationship between income and pollutant emissions is not homogeneous across countries. In global samples including low- and middle-income economies, emissions tend to increase with income; while in samples composed primarily of high-income countries, such as OECD members, an inverted U-shaped relationship may be observed, suggesting a possible reduction of certain pollutants once a higher income level is reached. Likewise, and reinforcing part of the above argument, Toledo and Chamba (2024) find that there is a positive association between electricity consumption and GDP in Latin America, such that countries with higher levels of energy consumption tend to record higher economic growth.
Altomonte et al. (2011) point out that Latin American economies tend to specialize in natural resource-intensive sectors, which are also high energy consumers, with low technological content and limited productive dynamism. Likewise, Barreto and Campo (2012) determined that, at the regional panel level, a 1% increase in energy consumption generates a 0.40% increase in GDP over the long term.
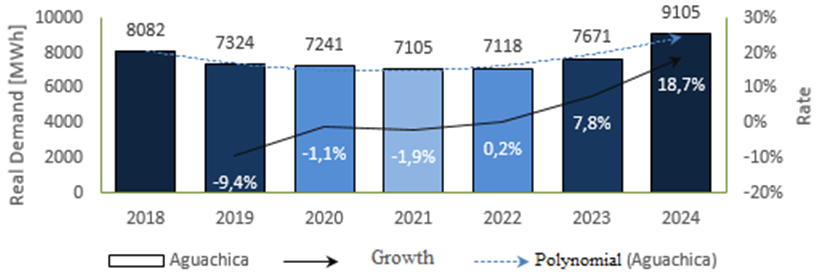
Figure 9 presents the evolution of the real energy demand of the municipality of Aguachica for the period 2018–2024, expressed in MWh and its respective annual growth rate (Ministerio de Minas y Energía, 2025).
Figure 9
Real energy demand (2018-2024)
Source: Own elaboration based on data from Sinergox (2025).
Regarding the energy demand of the municipality of Aguachica, a downward trend is evident between 2018 and 2021, recording a cumulative decrease of -12.1%, reaching its lowest level in 2021 at 7,105.01 MWh. This reduction could be linked to factors such as economic slowdown, energy use optimization, or the effect of the pandemic in 2020. Since 2022, demand began a moderate recovery of 0.19%, followed by a faster increase in 2023 of 7.77% and a rise of 18.69% in 2024, reaching its highest level in the period at 9,105.33 MWh.
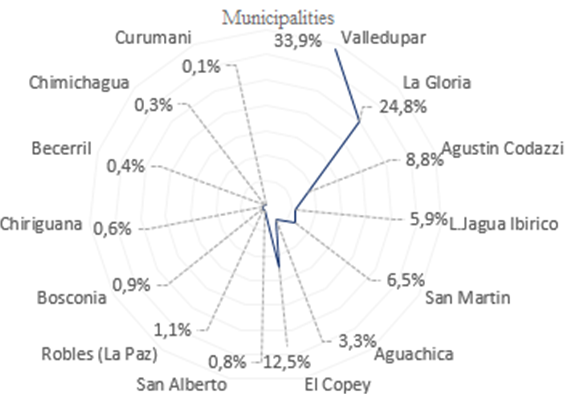
Figure 10 shows the historical share of real energy demand for the period 2018–2024, which includes several municipalities of the department of Cesar in order to contrast demand growth rates.
Figure 10
Historical share of real energy demand (2018-2024)
Source: Own elaboration based on data from Sinergox (2025).
Regarding the historical share of energy consumption in the department of Cesar, reflected in Figure 11, a high concentration is observed in the municipality of Valledupar, which accounts for 33.92% of departmental consumption and positions itself as the main hub of energy demand. It is followed by La Gloria, with a share of 24.84%, possibly associated with the dynamics of the palm oil industry in the municipality, and El Copey, with 12.53%, which could be related to significant industrial or agro-industrial activity.
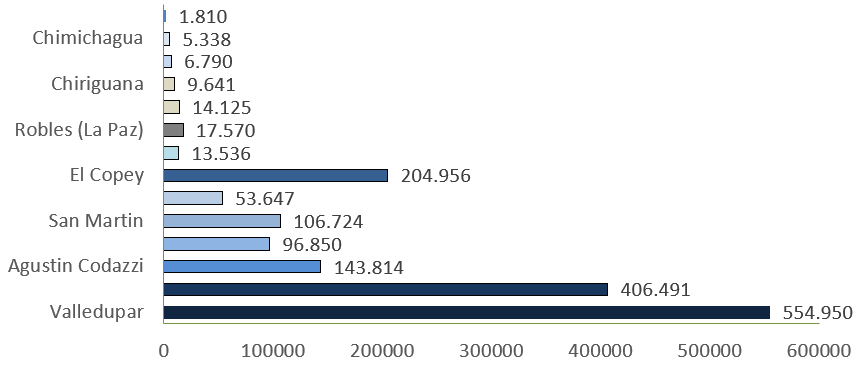
For its part, Aguachica records a share of 3.28%, reflecting a moderate contribution within the departmental energy consumption. This behavior suggests a relatively lower level of industrial development and energy demand compared to municipalities with a higher share. In this regard, Figure 11 presents the cumulative real energy demand during the period 2018–2024, expressed in MWh.
Figure 11
Cumulative real energy demand (2018–2024)
Source: Own elaboration based on data from Sinergox (2025).
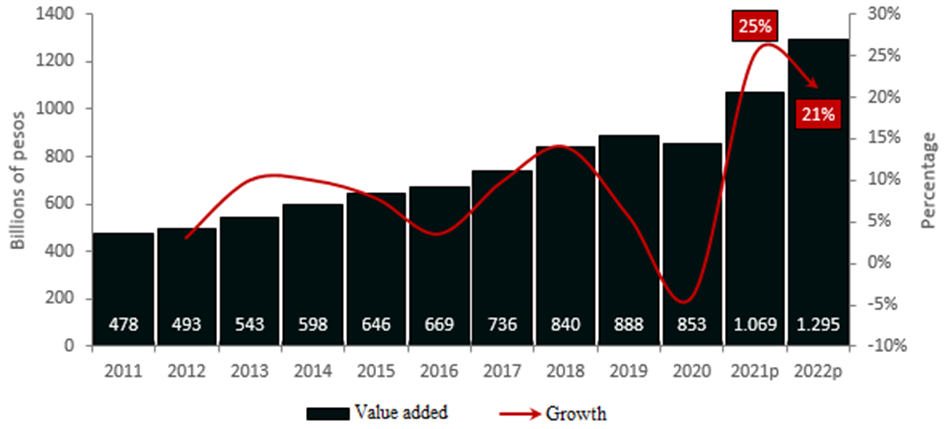
Energy consumption in Cesar shows substantial differences among its municipalities. Valledupar, with 554,950 MWh, leads the demand, followed by La Gloria with 406,491 and El Copey with 204,956, reflecting their greater economic activity and population density. Municipalities such as Codazzi with 143,813, San Martín with 106,723, and Aguachica with 53,646 show intermediate consumption levels. In contrast, localities such as Curumaní with 1,810, Chimichagua with 5,338, and Becerril with 6,790 have the lowest demand, which may be related to lower industrial activity and limited access to electricity infrastructure. As part of the economic analysis, Figure 12 presents the value added of the municipality of Aguachica for the period 2011–2022p, measured in billions of pesos.
Figure 12
Value added of the municipality of Aguachica (2011–2022)
Source: Own elaboration based on data from DANE (2022).
Regarding municipal value added (the value created in the production process through the combination of factors), sustained growth is evident, interrupted only by the contraction observed in 2020, when, due to the pandemic, the pace of expansion was reduced to 4%. However, in 2021 a rebound of 25% is estimated (provisional data), reaching 1.069 trillion pesos, followed by projected growth of 21% in 2022, with an estimated value added of 1.295 trillion.
The sectoral composition of value added shows a predominance of the tertiary sector, which broadly dominates the local economy, with a share of 68.84%, equivalent to 718.81 billion pesos for the year 2021, a sector composed of trade, transport, finance, education, and health services. It is followed by the secondary sector, representing 20.26% (211.60 billion), composed of manufacturing and relevant industrial activity, albeit less developed. Finally, primary activities (agricultural and extractive) account for 10.90% of the total (113.81 billion).
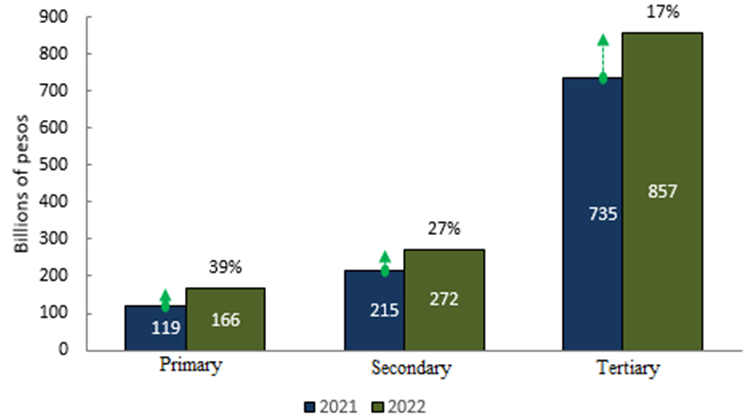
Figure 13 shows the value added in billions of pesos by activities for the years 2021–2022, differentiating the primary, secondary, and tertiary economic sectors.
Figure 13
Value added by main activities (2021-2022)
Source: Own elaboration based on data from DANE (2022).
According to data available as of 2025, all economic sectors recorded increases between 2021 and 2022. Primary activities showed the greatest relative growth, with an increase of 39%, rising from 119 billion to 166 billion pesos. Secondary activities grew by 27%, from 215 billion to 272 billion. Finally, the tertiary sector, which holds the greatest weight within the economic structure, recorded an increase of 17%, rising from 735 billion to 857 billion.
Environment and sustainable development
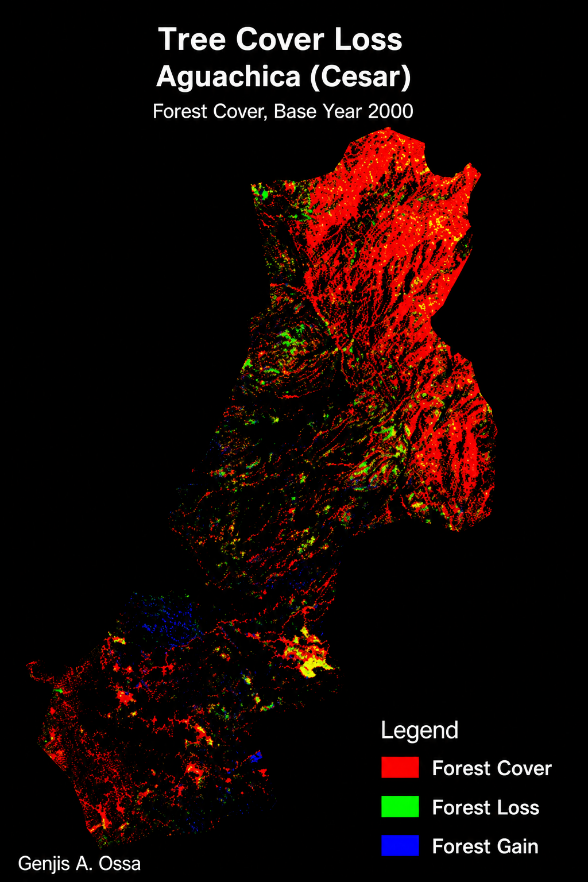
According to Global Forest Watch (GFW) between 2001 and 2023, 3.20 kha of relative tree cover was lost in Aguachica, equivalent to an 11% decrease since 2000 and 2.2% of all tree cover loss in Cesar. From 2021 to 2023, 100% of tree cover loss in Aguachica occurred within natural forest (Figure 14).
Figure 14
Forest cover loss in the municipality of Aguachica
Source: Own elaboration based on data from Hansen et al. (2013).
The total loss within natural forest amounted to approximately 580 hectares, equivalent to 267 kt of CO₂ emissions. Furthermore, in line with arguments from GFW (2025) between 2001 and 2023, tree cover loss in Aguachica generated an annual average of 63.0 kilotons of emissions. In total, during this period, 1.45 million tons of CO₂ equivalent were released into the atmosphere. As part of the Environment and Sustainable Development component, Figure 15 is presented, illustrating forest cover loss in the municipality of Aguachica for the period 2000–2023.
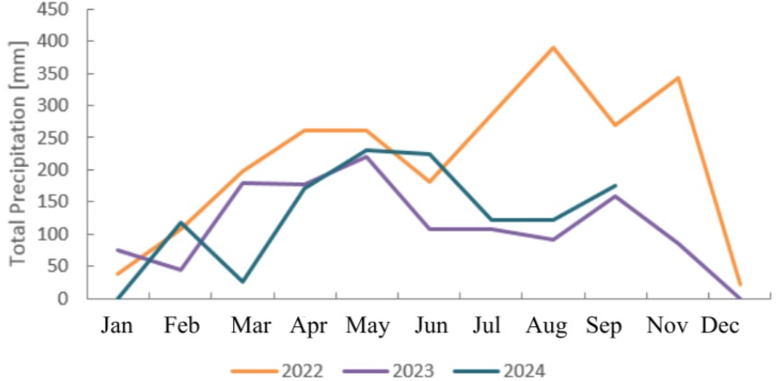
In Aguachica, the month with the highest precipitation in 2022 was August, with 390 mm; for 2023 and 2024, records indicate that September was the month with the highest precipitation, with 220 and 231 mm respectively (Figure 15). In contrast, the months with the lowest precipitation levels are December, January, and February. These records come from the Totumal weather station in the municipality of Aguachica.
Figure 15
Total monthly precipitation – Totumal station [23210130]
Source: Own elaboration based on data from the Institute of Hydrology, Meteorology and Environmental Studies (2025).
Based on the foregoing, Table 3 presents the historical data for the municipality, showing the evolution of air temperature at a height of 2 meters in Aguachica during the period 2022–2024. The data distinguishes between the average maximum and minimum temperatures recorded for the geographic coordinates Lat. 8.3105 and Long. -73.6071.
Table 3
Surface temperature in Aguachica (2022-2024)
Year |
Mean maximum temperature (°C) |
Mean minimum temperature (°C) |
2022 |
29,33 |
22,59 |
2023 |
30,47 |
23,219 |
2024 |
30,53 |
23,59 |
Source: Own elaboration based on data from Muñoz (2019).
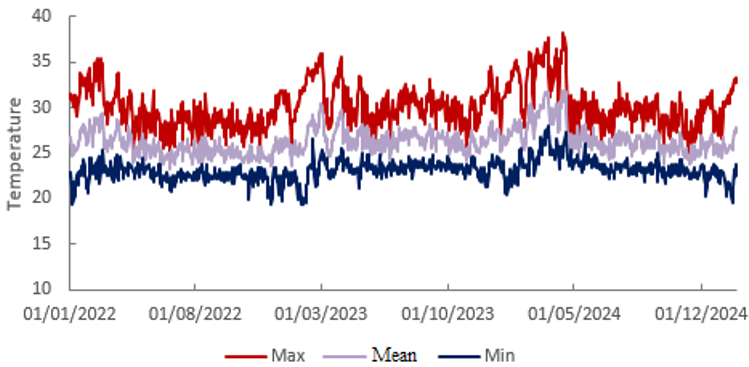
Figure 16 shows the air temperature at 2 meters above the surface in Aguachica, based on data from Muñoz (2019) for the coordinates (Lat. 8.3105, Long. -73.6071).
Figure 16
Superficial temperature (2022-2024)
Source: Own elaboration based on data from Muñoz (2019).
This temperature is obtained through an interpolation between the lowest level of the model and the land surface, taking atmospheric conditions into account. The average maximum temperature increased from 29.33 °C in 2022 to 30.54 °C in 2024, representing an increase of approximately 1.2 °C over three years. On the other hand, the average minimum temperature went from 22.59 °C in 2022 to 23.58 °C in 2024, with an increase of nearly 1 °C. This suggests a warming trend during the analyzed period.
Next, Table 4 presents the historical record of social public spending on the environmental component, with information from the Public Finance and Information Consolidator system (CHIP).
Table 4
Historical social public spending – environmental component
Year |
Item |
2019 |
142.760.000 |
2020 |
31.830.000 |
2021 |
79.910.000 |
2022 |
932.928.194 |
2023 |
4.059.732.276 |
2024 |
479.610.844 |
Source: Own elaboration based on data from CHIP (2025).
According to the information presented in the previous table, the local government allocated approximately 480 million pesos to social public spending on the environmental component during the last year. However, the historical analysis allows for the identification of marked volatility in environmental budget allocation, which reflects significant changes in the continuity, prioritization, and stability of resources allocated to this sector.
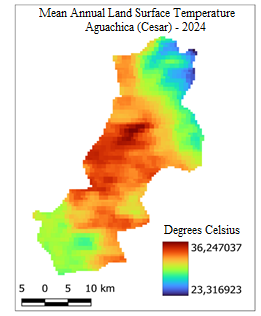
Figure 17 shows the surface temperature of Aguachica (Cesar) for the year 2024, using satellite data from Wan et al. (2021), processed through GEE and QGIS. It should be noted that, although the resource was published in 2021, its temporal coverage extends to the present (it is constantly updated).
Regarding the surface temperature of the municipality, it is evident that the urban core is the area that concentrates the most heat (Figure 17). It should be noted that the provider of this data is NASA LP DAAC at the USGS EROS Center, and that the data are obtained from pixels, where each pixel has an approximate spatial resolution of 1 km.
Thus, the northern area of the municipality shows lower temperatures, due to elevations exceeding 1,500 meters. The southern part of the municipality including the areas of Puerto Patiño, Loma de Corredor, and the wetland zone tends to record lower temperatures.
Figure 17
Surface temperature (2024)
Source: Own elaboration based on data from Wan et al. (2021).
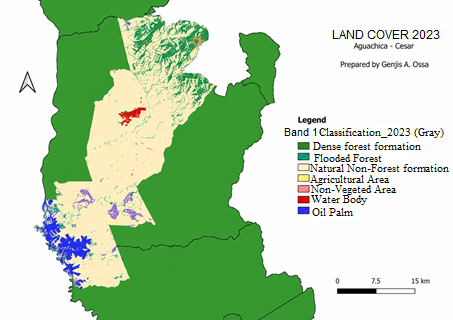
Figure 18 shows the land cover of the municipality of Aguachica, using data from MapBiomas. In 2023, land use shows a marked agricultural dominance: 81% of the territory is dedicated to agricultural or livestock activities. This is followed by forest formations, which cover 11%, and water bodies, with 5%. Non-forest natural formations account for barely 2%, while unvegetated areas represent only 1%.
Figure 18
Land cover of the municipality of Aguachica
Source: Own elaboration based on data from MapBiomas (2025).
Finally, within the Environment component, Table 5 is presented, which shows the environmental crimes recorded in the rural area of the municipality of Aguachica during 2024. According to information from the Ministry of Defense, 11 environmental crimes were reported that year, of which 10 correspond to illegal exploitation of natural resources and one to illegal extraction of mining deposits and other minerals.
Table 5
Environmental crimes in Aguachica – rural area (2024)
Concept |
Value |
Illegal exploitation of renewable natural resources |
10 |
Illegal extraction of mining deposits and other minerals |
1 |
Source: Own elaboration based on data from the Ministry of Defense (2025).
Discussions
The results obtained in this study align with theoretical approaches and empirical antecedents that allow for the interpretation of the territorial gaps identified in Aguachica. In the educational component, the progressive reduction in coverage between levels, especially in the transition from secondary to upper secondary education, coincides with the literature on school dropout in non-metropolitan contexts. This interpretation is consistent with Tinto (1975), who posits that school dropout is not solely a response to economic constraints, but also to difficulties of academic and institutional integration.
From an economic perspective, the results are consistent with the argument of Pritchett (2001), who warns that increased schooling does not, by itself, guarantee higher levels of productivity when educational quality is limited or the labor market fails to adequately absorb the trained human capital. In the case of Aguachica, the relative stagnation of State Exams Saber results may suggest or be a cause of the fact that the educational system has difficulties consolidating competencies that translate into meaningful improvements in local well-being and productivity. This behavior can be linked to what Cimoli and Correa (2005), in the work edited by Ocampo, describe as the “low-growth trap” understood as a dynamic associated with dual productive structures, low productivity, and weak economic linkages.
The urban-rural gaps identified in access to basic services reflect persistent territorial inequalities. While the municipal urban center shows relatively high coverage, rural areas display critical deficits, particularly in basic sanitation. This pattern aligns with national evidence, where infrastructure expansion has historically favored urban centers, reproducing conditions of rural exclusion and limiting productivity and quality of life in these areas (Departamento Nacional de Planeación [DNP], 2015).
On the economic front, the high share of the tertiary sector in municipal value added reflects a productive structure concentrated in service activities. From ECLAC's structuralist approach, this behavior can be interpreted as a form of tertiarization that does not necessarily imply a deep structural change, especially when these activities show low technological incorporation, limited productivity, and limited linkages to external markets. In this regard, the arguments of Pereira et al. (2023) allow us to understand that the expansion of the services sector, by itself, does not guarantee a sustainable productive transformation. Likewise, the relationship observed between the recovery of energy demand and economic growth in Aguachica is consistent with the findings of Barreto and Campo (2012) for Latin America, who note that regional growth tends to be associated with increased energy consumption and resource-intensive productive structures.
Conclusions
The results of this research allow us to conclude that Aguachica exhibits differentiated territorial gaps. These gaps are evident in the analyzed indicators for education, health, housing, public services, energy demand, economic structure, forest coverage, land use, and temperature. Taken together, the results confirm that the municipality faces multidimensional challenges that cannot be interpreted from a single isolated variable, but rather from a joint reading of its territorial conditions.
In the educational component, relatively high coverage was identified in the early levels of the school system, particularly in preschool transition and primary education. However, the data show a progressive reduction at higher levels, especially in the transition to upper secondary education. This finding allows us to conclude that the municipality's main educational problem is not concentrated solely in initial access, but in the permanence and continuity of school trajectories. At the same time, the behavior of State Exams results in mathematics and critical reading shows very low variations during the analyzed period.
In health and demographic dynamics, municipal coverage remains close to the departmental trend; however, with a recent decline in the affiliation indicator. This result may indicate that, although there is a significant level of access to the health system, the observed downward trend constitutes a warning signal. Additionally, the reduction in live births toward 2023 also shows changes in the municipal population dynamics, an aspect that is relevant for the planning of social, educational, and health services in the medium term.
In terms of housing and public services, the results show a marked territorial inequality between the municipal urban center, rural populated centers, and dispersed rural areas. While the urban center shows high coverage in water supply, sewage, and natural gas, rural areas record critical access levels, particularly in sewage and domestic gas. Likewise, the decrease in rural electricity coverage after 2015 and the increase in the quantitative housing deficit reveal limitations in infrastructure expansion and housing supply.
From the economic dimension, municipal value added shows a recovery following the contraction recorded in 2020, with significant growth in subsequent years. However, the sectoral composition shows a predominance of the tertiary sector, which confirms that the local economy is primarily concentrated in service activities. This points to the need to strengthen productive diversification, industrial development, the expansion of local economic linkages, and the promotion of activities with greater capacity for employment generation and value added.
In the energy dimension, Aguachica's real demand showed a decrease between 2018 and 2021, followed by a recovery between 2022 and 2024. However, the municipality's share of departmental energy demand remains moderate compared to other municipalities in Cesar.
In the environmental component, the results show a loss of tree cover between 2001 and 2023, a predominance of agricultural land use, and an increase in average temperatures between 2022 and 2024. These results support the argument that the municipality faces environmental pressures associated with land transformation, reduction of vegetative cover, and recent thermal increase.
Therefore, the study shows that the educational, social, urban, economic, energy, and environmental gaps of Aguachica represent a pattern of unequal territorial development. The information presented shows that the greatest tensions are concentrated in educational continuity, urban-rural inequalities in basic services, sectoral concentration of the economy, and environmental pressures on the territory. Therefore, municipal public planning must be based on empirical evidence and prioritize interventions aimed at closing gaps, particularly in upper secondary education, rural basic sanitation, housing infrastructure, productive diversification, and environmental management.
Finally, this research provides a useful diagnostic foundation for understanding the territorial conditions of Aguachica based on official sources and geospatial tools. However, it is acknowledged that the study is limited to a descriptive and longitudinal analysis of available indicators, and therefore does not aim to establish causal relationships between variables. Future research is recommended to extend the temporal horizon, incorporate primary data, and apply statistical, spatial, or econometric models that allow for deeper exploration of the interaction between education, productive structure, public services, energy demand, and environmental sustainability.
Ethical considerations
This research did not require ethical approval as it was based on documents from governmental and non-governmental institutions.
Conflict de interest
The author declares no conflicts of interest related to the preparation and publication of this article.
Source of funding
This article was not funded by any public or private entity.
References
(1)Altomonte, H., Correa, N. y Rivas, D. (2011). La dinámica del consumo energético industrial en América Latina y sus implicancias para un desarrollo sostenible. Revista de la CEPAL, (105), 7-37. https://www.cepal.org/es/hojasinformativas/la-dinamica-consumo-energetico-industrial-america-latina-sus-implicancias-un
(2)Barreto, C. A. y Campo, J. (2012). Relación a largo plazo entre consumo de energía y PIB en América Latina: Una evaluación empírica con datos panel. ECOS de Economía, 16(35), 73-89. http://www.scielo.org.co/pdf/ecos/v16n35/v16n35a4.pdf
(3)Cimoli, M. y Correa, N. (2005). La apertura comercial y la brecha tecnológica en América Latina: una “trampa de bajo crecimiento”. CEPAL. https://repositorio.cepal.org/bitstream/handle/11362/1876/S3301O15M_es.pdf
(4)Consolidador de Hacienda Publica (CHIP). (2025). Información contable de convergencia. https://www.chip.gov.co/schip_rt/index.jsf
(5)Departamento Nacional de Estadística (DANE). (2018). Censo Nacional de Población y Vivienda. https://www.dane.gov.co/index.php/estadisticas-por-tema/demografia-y-poblacion/censo-nacional-de-poblacion-y-vivenda-2018
(6)Departamento Nacional de Estadística (DANE). (2022). Guía de Uso - Geovisor Valor Agregado por Municipio - Base 2015. https://geoportal.dane.gov.co/geovisores/economia/valor-agregado-por-municipio/
(7)Departamento Nacional de Estadística (DANE). (2025). Estadísticas vitales nacimientos y defunciones. https://app.powerbi.com/view?r=eyJrIjoiYWVhNmM2ZDItNTg1MC00YjRmLWE1OTYtNjg3NmRmOGM4MTFmIiwidCI6IjBkMWRlMzRkLWFmNDktNGJmNS1iOGVlLTNjM2M0NGNlNzk0MiIsImMiOjR9
(8)Departamento Nacional de Planeación (DNP). (2015). Misión para la transformación del campo. https://colaboracion.dnp.gov.co/CDT/Agriculturapecuarioforestal%20y%20pesca/Estrategia%20de%20Competitividad%20para%20el%20Sector%20Agropecuario%20V2015-10-23.pdf
(9)Espinosa, E. y León, A. (2002). La deserción escolar en América Latina: un tema prioritario. Organización de Estados Iberoamericanos (OEI). https://rieoei.org/historico/documentos/rie30a02.htm
(10)Global Forest Watch (GFW). (2025). Monitoreo de bosques diseñado para la acción. https://www.globalforestwatch.org/
(11)Hansen, M. C., Potapov, P. V., Moore, R., Hancher, M., Turubanova, S. A., Tyukavina, A., Thau, D., Stehman, S. V., Goetz, S. J., Loveland, T. R., Kommareddy, A., Egorov, A., Chini, L., Justice, C. O. & Townshend, J. R. G. (2013). High-resolution global maps of 21st-century forest cover change. Science, 342(6160), 850–853. https://glad.earthengine.app/view/global-forest-change#bl=off;old=off;dl=1;lon=20;lat=10;zoom=3;
(12)Instituto de Hidrología, Meteorología y Estudios Ambientales. (2025). Consulta y Descarga de Datos Hidrometeorológicos. http://dhime.ideam.gov.co/atencionciudadano/
(13)MapBiomas. (2025). Mapa y plataforma de datos. https://colombia.mapbiomas.org/
(14)Ministerio de Defensa Nacional (Mindefensa). (2025). Seguimiento a indicadores y resultados operacionales. https://www.mindefensa.gov.co/defensa-y-seguridad/datos-y-cifras/informacion-estadistica
(15)Ministerio de Educación Nacional (MinEducación). (2024). Indicadores educativos (Aprobación, Deserción, tasas de cobertura, reprobación y matriculación) desagregado por Municipio. https://www.datos.gov.co/Educaci-n/MEN_ESTADISTICAS_EN_EDUCACION_EN_PREESCOLAR-B-SICA/nudc-7mev/about_data
(16)Ministerio de Minas y Energía. (2025). Estaciones de Servicio Automotriz y Fluvial: Despacho de combustibles líquidos a nivel nacional (AUTOMATIZADO). https://www.datos.gov.co/Minas-y-Energ-a/Estaciones-de-Servicio-Automotriz-y-Fluvial-Despac/fbht-2fzd/about_data
(17)Ministerio de Salud y Protección Social. (2025). Cifras de afiliación en salud. https://www.minsalud.gov.co/Proteccion-Social/Paginas/cifras-aseguramiento-salud.aspx
(18)Ministerio de Transporte. (2023). Valores reportados en manifiestos de carga. https://plc.mintransporte.gov.co/Estad%C3%ADsticas/Carga-Modo-Terrestre/Tablero-Valores/Valores-RNDC-2023
(19)Ministerio de Vivienda, Ciudad y Territorio. (2025). Subsidios de Vivienda Asignados. https://www.datos.gov.co/Vivienda-Ciudad-y-Territorio/Subsidios-De-Vivienda-Asignados/h2yr-zfb2/about_data
(20)Muñoz, J. (2019). Datos promedio mensuales de ERA5-Land desde 1981 hasta la actualidad. Almacén de Datos Climáticos (CDS), Servicio de Cambio Climático de Copernicus (C3S). https://doi.org/10.24381/cds.68d2bb30
(21)Ocampo, J. A. (2002). La educación en la actual inflexión del desarrollo de América Latina y el Caribe. Revista Iberoamericana de Educación, (30), 25-37. https://doi.org/10.35362/rie300940
(22)Pereira, W. M., Missio, F. J. y Jayme Jr, F. G. (2023). El papel de los servicios en el desarrollo económico y la relación centro-periferia. Revista de la CEPAL, (140), 29-60. https://repositorio.cepal.org/server/api/core/bitstreams/a5278523-a2c7-48f0-95fe-1b2caf4b6144/content
(23)Pritchett, L. (2001). Where has all the education gone? The world bank economic review, 15(3), 367-391. https://doi.org/10.1093/wber/15.3.367
(24)Román, M. (2013). Factores asociados al abandono y la deserción escolar en América Latina: una mirada en conjunto. Revista Iberoamericana sobre Calidad, Eficacia y Cambio en Educación, 11(2), 33–59. https://www.redalyc.org/pdf/551/55127024002.pdf?
(25)Seri, C. & de Juan, A. (2021). The relationship between economic growth and the environment: Testing the EKC hypothesis. Ecological Indicators, 127, 107746. https://arxiv.org/pdf/2105.11405
(26)Sinergox. (2024). Demandas y Fronteras – Históricos. https://sinergox.xm.com.co/dmnd/Paginas/Informes/VariacionDemandaComercial.aspx
(27)Stern, D. I. & Common, M. S. (2001). Is there an environmental Kuznets curve for sulfur? Journal of Environmental Economics and Management, 41(2), 162–178. https://doi.org/10.1006/jeem.2000.1132
(28)TerriData. (2025a). Vivienda y acceso a servicios públicos. https://TerriData.dnp.gov.co/index-app.html#/comparaciones
(29)TerriData. (2025b). Educación. https://TerriData.dnp.gov.co/index-app.html#/comparaciones
(30)Tinto, V. (1975). Dropout from higher education: A theoretical synthesis of recent research. Review of Educational Research, 45(1), 89–125. https://doi.org/10.3102/00346543045001089
(31)Toledo, E. and Chamba, P. (2024). Consumo de Energía y Crecimiento Económico en América Latina. Revista Internacional de Estudios en Ciencias Administrativas STRATEGOS, 4(2), 1-14. https://doi.org/10.53591/strategos.v4i2.2070
(32)Wan, Z., Hook, S. & Hulley, G. (2021). MODIS/Terra land surface temperature/emissivity daily L3 global 1 km SIN grid V061. NASA LP DAAC. https://doi.org/10.5067/MODIS/MOD11A1.061