RESEARCH ARTICLE
Economic growth
BUSINESS CYCLES IN COLOMBIA: STYLIZED FACTS
CICLOS ECONÓMICOS EN COLOMBIA: HECHOS ESTILIZADOS
CICLOS DE NEGÓCIOS NA COLÔMBIA: FATOS ESTILIZADOS
Por: 1 Mario Eduardo Hidalgo Villota ![]()
1 Master in Public Policy, Universidad del Valle. Assistant Professor, Department of Economics, Universidad de Nariño. Research Group in Economics, Government and Public Policy, Universidad de Nariño. ORCID: 0000-0002-5579-6136. E-mail: mariohidalgo@udenar.edu.co, Pasto - Colombia.
Received: May 25, 2023 Approved: April 08, 2024
DOI: https://doi.org/10.22267/rtend.242502.253
![]()
Abstract
The purpose of this article is to examine the economic cycles in Colombia and to empirically corroborate the fulfillment of nine stylized facts documented in the specialized international literature. For this purpose, the retropolated series 1975-2013 and the series 2005:1-2022:4 of the National Administrative Department of Statistics (DANE) were analyzed using the Hodrick-Prescott filter. Thus, the occurrence of four economic cycles is recorded between 1975 and 2013 with an average duration of 9.3 years with an expansionary phase of 5.0 years and a contractionary phase of 5.3 years. Similarly, between 2005:1 and 2022:4 there were three cycles with an average duration of 21.7 quarters, with an expansionary phase of 14.7 quarters and a contractionary phase of 7.0 quarters. It should also be said that the cyclical fluctuations of employment and unemployment are closely related to effective demand and domestic demand in accordance with Keynesian theory; for example, the positive correlation between the real GDP cycle and the implicit GDP deflator cycle suggests that the cycles were not due to shifts in the aggregate production function as the dominant theory stresses, but to shifts in the aggregate demand function.
Keywords: economic conditions; economic equilibrium; economic policy; economic recovery; economic recession.
JEL:E30; E32; E60; E61; E69.
Resumen
El propósito de este artículo es examinar los ciclos económicos en Colombia y corroborar empíricamente el cumplimiento de nueve hechos estilizados documentados en la literatura internacional especializada. Para ello, se analizó la serie retropolada 1975-2013 y la serie 2005:1-2022:4 del Departamento Administrativo Nacional de Estadística (DANE), empleando el filtro Hodrick-Prescott. Así pues, se registra la ocurrencia de cuatro ciclos económicos entre 1975 y 2013, con una duración de 9.3 años en promedio, con una fase expansiva de 5.0 años y una fase contractiva de 5.3 años. De igual modo, entre 2005:1 y 2022:4 se registraron tres ciclos con una duración de 21.7 trimestres en promedio, con una fase expansiva de 14.7 trimestres y una fase contractiva de 7.0 trimestres. Habría que decir también, que las fluctuaciones cíclicas del empleo y del desempleo guardan una relación estrecha con la demanda efectiva y la demanda interna en concordancia con la teoría keynesiana; por ejemplo, la correlación positiva entre el ciclo del PIB real y el ciclo del deflactor implícito del PIB sugiere que los ciclos no se debieron a desplazamientos de la función de producción agregada como subraya la teoría dominante, sino a desplazamientos de la función de demanda agregada.
Palabras clave: condiciones económicas; equilibrio económico; política económica; reactivación económica; recesión económica.
JEL: E30; E32; E60; E61; E69.
Resumo
O objetivo deste artigo é examinar os ciclos de negócios na Colômbia e corroborar empiricamente o cumprimento de nove fatos estilizados documentados na literatura internacional especializada. Para isso, foram analisadas as séries retropoladas de 1975-2013 e as séries de 2005:1-2022:4 do Departamento Administrativo Nacional de Estatística (DANE), usando o filtro Hodrick-Prescott. Assim, a ocorrência de quatro ciclos econômicos é registrada entre 1975 e 2013, com duração média de 9,3 anos, com uma fase de expansão de 5,0 anos e uma fase de contração de 5,3 anos. Da mesma forma, entre 2005:1 e 2022:4, houve três ciclos com duração média de 21,7 trimestres, com uma fase de expansão de 14,7 trimestres e uma fase de contração de 7,0 trimestres. Deve-se observar também que as flutuações cíclicas no emprego e no desemprego estão intimamente relacionadas à demanda efetiva e à demanda doméstica, de acordo com a teoria keynesiana; por exemplo, a correlação positiva entre o ciclo do PIB real e o ciclo do deflator implícito do PIB sugere que os ciclos não se deveram a mudanças na função de produção agregada, conforme enfatizado pela teoria convencional, mas a mudanças na função de demanda agregada.
Palavras-chave: condições econômicas; equilíbrio econômico; política econômica; recuperação econômica; recessão econômica.
JEL: E30; E32; E60; E61; E69.
Introduction
Business cycles are fluctuations in aggregate economic activity, mainly present in countries with market economies. According to the classic definition of Burns & Wesley (1946), business cycles are recurrent in those countries that organize their work essentially through companies as the architects of production and seek to maximize their profits. Although the duration of business cycles is not periodic (it can range from one to ten years, generally), the phases of expansion and contraction are repeated.
Lucas (1977) states that all business cycles are the same in terms of the covariations of economic series related to real GDP. These occur in decentralized market economies in a non-periodic manner in terms of their duration, distinguishing, thus: short or Kitchin cycles of 40 months on average, medium or Juglar cycles of 8.5 years on average and long or Kondratieff cycles of 50 or 60 years on average. Although this classification can give an approximate idea of the magnitude of a cycle, it is often criticized because of the unequal level of persistence of the economic cycle.
The production of goods and services is considered by economists and politicians as the great savior of employment and the solution to unemployment, although this assertion refers more to the quantitative dimension of employment (creation of a greater number of jobs) than to its quality. A key aspect to take into account in the increase of production is that it does not grow homogeneously; sometimes the GDP growth rate is very dynamic, reaching spectacular levels and, on other occasions, the rates are very low, even negative, with disastrous economic results in terms of human suffering.
Thus, economic theory predicts that the fate of employment or unemployment is tied to the growth/decrease of production, but in an inconsistent and imperfect way. In this order of ideas, the good or bad results in terms of employment/unemployment will depend substantially on the sharpness and expertise of the economic authorities and on the macroeconomic stabilization policies designed and implemented, focused on smoothing the cycle instead of amplifying it. It should be noted that the mistakes in the choice of inadequate macroeconomic stabilization policies can be explained by the lack of knowledge on the part of policy makers of the exact phase of the cycle in which the economy is at a given moment, due to the backlog of statistical information in the national accounts systems and the impossibility of accurately predicting the behavior of economic agents, despite the fact that countries such as the United States have adopted leading indicator systems for the early detection of the phases of the economic cycle based on the collection and analysis of multiple variables.
The economic literature on cyclical fluctuations is extensive and complex, showing important scientific advances in recent times for the understanding of how economic systems work; however, the main questions that inquire into the determinants of economic cycles remain unresolved. It seems that the various theoretical paradigms that attempt to explain the recurrent sequences of expansions-contractions-expansions through a variety of theories are not entirely satisfactory. The content of this article will be concerned with providing some empirical elements that characterize the economic cycles in Colombia, specifically, it corroborates the fulfillment of common stylized facts in the capitalist accumulation systems.
Methodology
The specialized literature recommends studying economic cycles from quarterly time series that include several decades, in order to appreciate in greater detail, the cyclical fluctuations of real GDP and its related variables. Unfortunately, the Colombian system of national accounts does not have this type of information; in its absence, the stylized facts of the economic cycles were analyzed with macroeconomic statistics from the system of national accounts base 2015, using the retropolated series for the period 1975-2013 and the 2005:1-2022:4 series of quarterly frequency. For the estimation of Okun's Law in Colombia, the 1980-2020 annual series available in the departmental economic accounts system was taken. The results of the econometric estimations are shown in Annexes 1 and 2.
The quarterly time series used were deseasonalized and transformed into natural logarithms, taking into account that the variations of the logarithm of a variable X approximately reflect the percentage variations of the original variable X. The study of economic cycles is not a simple exercise; in order to understand their behavior and their close relationship with employment/unemployment, we proceeded to decompose the economic series into their trend (which describes the long-term behavior of the series) and their short-term cyclical fluctuations using the Hodrick & Prescott (1997) filter. However, "there is widespread concern about its use, given that the cyclical regularities that can be extracted are not invariant to the filter" (Parra, 2008, p. 38). This filtering method allows removing the trend of the time series previously transformed into natural logarithms and its growth component (gt), minimizing the magnitude of the series (Sorensen & Whitta, 2009), as shown in Equation 1:

With respect to all values of gt, observations are available from time t=1, 2,...T and with λ (lambda) being a parameter taking values of 100 for annual frequency data and 1,600 for quarterly frequency data. Note that since yt is measured in logarithms, the magnitudes gt+1, -gt and gt - gt-1, are approximately the percentage growth rates of the trend value of real GDP in periods t+1 and t, respectively. The bracketed term in Equation 1 measures the change in the estimated trend rate of growth from one period to the next. The term yt - gt of the same equation measures the cyclical component ct of the natural logarithm of GDP for period t.
Economic cycles in Colombia were measured from bottom to bottom considering three practical rules of thumb in general use, namely: a) a bottom must be followed by a peak and a peak is followed by a bottom; b) the expansion and contraction phases of a cycle last at least two quarters; and c) a cycle lasts a minimum of five quarters. In addition to the exercise of characterizing the economic cycles, labor market statistics from the National Administrative Department of Statistics (DANE) were used to estimate the creation and destruction of employment in the period 2005:1-2022:4 during the expansion and contraction phases of the cycle.
Results
Theoretical paradigms on business cycles
Schumpeter (1939) is considered one of the most outstanding economists in the study of business cycles, to which he devoted a large part of his monumental scientific work. He famously used the analogy of comparing business cycles with the heartbeat, which resembles a set of waves (for example, an electrocardiogram). Cycles were, for Schumpeter, the essential elements of capitalist economic life and, on their correct interpretation, depended how to find an answer to the great problems of the economy. Hence, the scientific interest of 20th century theoreticians in understanding them initially and, subsequently, in "controlling" them to ensure the stability and permanence of the system of capitalist accumulation. From this perspective, capitalist crises would be resolved by smoothing the cycle through anticipated economic policy measures, in such a way as to make cyclical fluctuations coincide perfectly with the long-term trend of real GDP (overlapping of variables), an improbable situation in practical terms.
Schumpeter is credited with the theory of innovation, which is described as the transformation of the production function without changing the composition of the initial productive factors (the quantities of capital and labor remain constant), simply changing the way in which these factors are combined or used. In other words, the alteration of the initial production function gives rise to a new production function that results in a significant increase in the total productivity of the factors, which Solow (1956; 1957) would later call technical change, which is interpreted as a "measure of our ignorance" because, in reality, no one today knows how it arises. The new production function is nothing more than the set of historical and irreversible changes in the way of doing the same things, but in a different way, bringing about innovations in the product, in the organization of production, in distribution, in marketing, among others.
Schumpeter (2015) adds to his theory of innovation, the importance of the entrepreneur's leadership as the manager of innovation and creator of new companies that will increase the existing production in the "wave of business" in the struggle of the new against the old (Rodríguez, 2005). This is reflected in the opening of new markets, in the appearance of new consumer goods, in the introduction of new raw materials, in the design and incorporation of new production and transportation methods that emerge within the company and are rapidly disseminated in the economy as a whole.
Marx (2017) studied economic crises as one of the phases of the economic cycle, in particular, the industrial cycle as a phenomenon of interest in the midst of the industrial revolution in the eighteenth century. This author, defines them as momentary violent eruptions arising from the contradictions of the capitalist system, whose function is to restore the disturbed balance of capitalism, derived from the overaccumulation of capital. Marx attributes the causes of economic crises to a systematic reduction of the average rate of profit and to an insufficient demand for consumer goods; that is, to a persistent imbalance between production and realization (sales).
The overproduction of capital means that "the capitalist system has produced too much with a view to enrichment, or that too great a part of the product is destined, not for consumption as income, but to obtain more money for accumulation" (Guerrero, 2011, p. 82). In short, crises are an opportunity to clean up the capitalist system (in other words, to expel non-competitive companies from the market) in order to trigger a new wave of investment that will restore production to its optimal level. However, this situation will not be sustainable for long, giving rise to a new crisis.
For his part, Kondratieff (1944) analyzes long cycles with a duration of 48 to 55 years, merging Marshall (1948) equilibrium theory with Marx (2017) industrial cycle theory. Although the measurement of a long cycle lacks empirical substantiation, the upward phase of the cycle is explained by the increased incorporation of capital goods into the productive process; possibly, the result of radical innovations and by the regrouping of productive forces above equilibrium. The downward phase is explained by the decrease in capital, which leads to production below the equilibrium level (Rodríguez, 2005). Mandel (1998) is the continuator of the study of long waves. For him, the expansive and contractive phases of the long waves correspond to the rise or fall of the long-term capitalist rate of profit, as well as to the internal contradictions of capitalist accumulation, which are more noticeable in the declining phase of the cycle.
For Hayek, as an advocate of monetary neutrality, economic crises are the consequence of monetary manipulation without effects on real production, in particular, it is the direct fault of the secondary creation of money mediated by credit (Gómez, 2008). Hayek (1996) concludes that an artificial expansion of credit unsupported by prior voluntary savings, motivated by a reduction in the interest rate, tends to increase investment (necessarily, without it being profitable) and to create a false economic boom due to the distortion of relative prices (higher inflation) as an effect of the increase of money in circulation without positive effects on real production (economic growth) and employment.
The more modern neoclassical theory of real business cycles emerged in the 1980s under the leadership of Kydland & Prescott (1982) and Long & Plosser (1983), who rejected outright that anticipated monetary shocks (on the demand side) are responsible for fluctuations in real output and employment. On the contrary, they defend the theory that persistent real shocks (on the supply side) cause large random fluctuations in the rate of technical progress or change that displace the production function. In the face of such technological shocks, economic agents adjust their behavior with optimal responses; consequently, the real cycle theory does not support the adoption of counter-cyclical economic policies that would prevent the economy from moving away from its optimal situation.
While in the first half of the 20th century special attention was paid to the comovement of many individual economic series and to the behavior of the economy during expansions and contractions, today the most prominent contributions to the study of the business cycle are dynamic factor models and nonlinear models of regime switching (Diebold & Rudebusch, 1996). Today, much more is known about cyclical fluctuations, but unfortunately, not enough is known to avoid them, considering that the long-term trend and cyclical fluctuations are not, in themselves, objective realities, but rather abstract theoretical constructs (Escobar, 2005).
Okun's Law: a fickle and turbulent relationship
In principle, it seems obvious that GDP and the number of employed persons must be related. After all, in order to produce more goods and services, it is usually necessary to employ a larger number of workers. However, this relationship is not easy to identify; rather, it is a turbulent relationship (Jimeno, 2016). These differences can be explained by the fact that many factors are involved in the relationship between GDP growth and job creation, some of which can be quantified and others of a qualitative nature that cannot be measured; thus, in this relationship, it is not the same if the economy is in recession as if it is expanding, nor is it the same if economic activity is growing driven by greater demand or for other reasons. In the short and long term, the conditions that determine economic variables are usually different depending on the chosen horizon.
In the short term, the GDP growth rate is more important, while in the long term what is really relevant is the increase in average labor productivity and total factor productivity (TFP), called by economists as technical change, technological progress (Solow, 1956) or jocularly, "a measure of our ignorance", since in truth, despite scientific efforts and advances in economic science, there is no satisfactory explanation of how the Solow residual arises.
The relationship between GDP growth and job creation is quite misunderstood and turbulent (Jimeno, 2016), since in economics there are no unidirectional causal relationships between economic variables. Economic agents make decisions taking into account many factors associated with the past, present and future. Similarly, the interactions of economic agents are multiple and complex, calling into question the reasoning of the typical causal relationship between x and y, widely developed and disseminated by econometric theory.
The neoclassical tradition tried to give a lucid answer to the recurrent question among economists in the sixties. ¿How much economic growth is necessary to reduce unemployment, so that an economy reaches full employment? Thus was born a famous empirical relationship enunciated in 1962 known as Okun's Law in honor of its author, the economist Arthur Okun in 1962. This law states that unemployment entails enormous intertemporal economic and social costs due to its depressive effects. Next, Okun's Law is estimated for the Colombian economy, based on Equation 2:
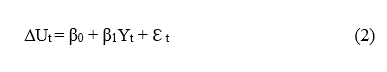
Where: ∆Ut = Change in real unemployment; β0 = constant indicating the rate of change in long-term unemployment due to structural factors (demographic, institutional, technological, among others); β1 = parameter relating changes in unemployment to changes in output, reflecting the dynamic relationship between changes in unemployment and long-term economic growth; Yt = real GDP; ℇt = disturbance term. The estimation of the model corresponds to Equation 3, with its detail in Annex 1.
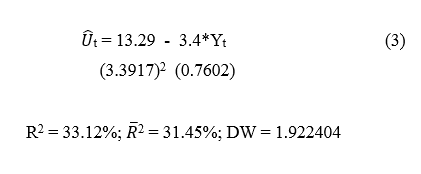
β1 = Okun's Coefficient calculated from: β1 = 3.4 then: 1/β1 = 1/3.4 = 0.3
According to Okun (1962) literal interpretation, for each percentage point of growth in national product (GDP), the variation in unemployment will be -0.3 percentage points and, equivalently, a one percentage point increase in the unemployment rate reduces national product by 3.4 percentage points. In other words, if GDP increases by 1%, unemployment will decrease by 0.3% and if unemployment increases by 1% then GDP will decrease by 3.4%. Note that Okun's Law predicts for Colombia a ratio of 1 to 3.4 compared to Arthur Okun's calculations for the United States of 1 to 2 in the period 1947:2-1960:4. Considering this empirical regularity, the Colombian economy should grow by 3.4% for the unemployment rate to decrease by 1%.
The value of Okun's coefficient (β1) may change as the period of analysis is altered. By estimating Okun's Law in first differences with quarterly frequency series, Equation 4 is obtained, with the level of detail available in Annex 2.
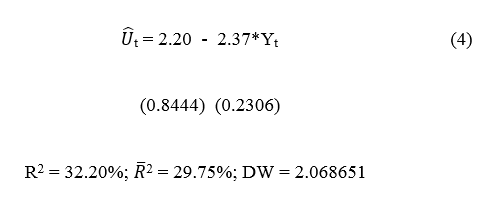
Where: β1 = 2.37 then: 1/β1 = 1/2.37 = 0.4
Now, for each percentage point of national product growth, the variation in unemployment would be - 0.4 percentage points and, equivalently, a one percentage point increase in the unemployment rate would reduce national product by 2.4 percentage points. Note that the unemployment to product ratio was reduced from 1:3.4 to 1:2.4; which suggests that Colombia's economic growth effort is lower (2.4%) with respect to a possible goal of reducing unemployment by 1%. This leads to think that the famous Okun's Law as a rule of thumb is inconsistent and inaccurate as all relationships between economic variables, despite the sophistication of statistical and econometric techniques that could be incorporated into economic analysis. In short, Okun's Law lacks a solid theory to support it (Snowdon & Vane, 1999), it is simply an empirical relationship.
Duration of economic cycles in Colombia
Lucas (1977) reawakened interest in the study of business cycles in the 1970s. For their part, Kydland & Prescott (1987; 1990) specify a series of regularities of business cycles as the relationships between GDP fluctuations and their related series (consumption, investment, public spending, exports, imports, employment, unemployment, among others), giving rise to concepts such as: relative amplitudes between the fluctuations of the series, the procyclical, countercyclical and acyclical character, as well as the leading, coincident or lagging behavior of each series in relation to the fluctuations of real GDP as the focal variable. These conceptual and empirical developments are highly significant for understanding the degree of association between fluctuations in GDP and fluctuations in employment and unemployment.
Empirical evidence worldwide allows inferring that a representative economic cycle has an average duration of between 10 and 12 years, measured from bottom to bottom, and that in modern times the expansionary phase of the cycle has a longer duration than the contractionary phase, as a consequence of economic policies that try to soften it (Sorensen & Whitta, 2009). The data in Colombia is more consistent with the first statement when taking annual frequency series from the period 1975-2013 (9.3 years on average), but it is less consistent regarding the duration of the expansionary phase compared to the contractionary phase of the cycle. Taking the same period of analysis, a small difference in favor of the contractionary phase can be seen, which could imply a certain failure of economic policy motivated by the economic authorities' ignorance of the exact phase of the cycle and by the procyclical nature of Colombian economic policy, as will be described below (Table 1).
Table 1
Measuring the business cycle in Colombia 1975-2013
Cycle (bottom to bottom in years) |
Expansion (years) |
Contraction (years) |
Ratio Exp/Cont |
||||||
Start |
End |
Duration |
Start |
End |
Duration |
Start |
End |
Duration |
|
1977 |
1985 |
9 |
1977 |
1980 |
4 |
1980 |
1985 |
6 |
0.67 |
1985 |
1992 |
8 |
1985 |
1988 |
4 |
1988 |
1992 |
5 |
0.80 |
1992 |
2002 |
11 |
1992 |
1997 |
6 |
1997 |
2002 |
6 |
1.00 |
2002 |
2010 |
9 |
2002 |
2007 |
6 |
2007 |
2010 |
4 |
1.50 |
Average |
|
9.3 |
|
|
5.0 |
|
|
5.3 |
1.0 |
The percentage difference between real GDP and its trend value is equivalent to the output gap (Lora y Prada, 2016). When the gap is positive (actual GDP greater than potential GDP), it means that the economy is expanding; on the other hand, if the gap is negative (actual GDP less than potential GDP), it is interpreted that productive factors are underutilized. In Figure 1, the red line corresponds to potential GDP and the blue line to effective GDP. The intersection or cut-off points of the red and blue lines, at least theoretically , are interpreted as moments of full employment, i.e., equilibrium points where economic activity coincides perfectly with the natural rate of unemployment.
Figure 1
Business Cycles in Colombia 1975-2013 and 2005:1-2022:4 (Hodrick-Prescott filter)
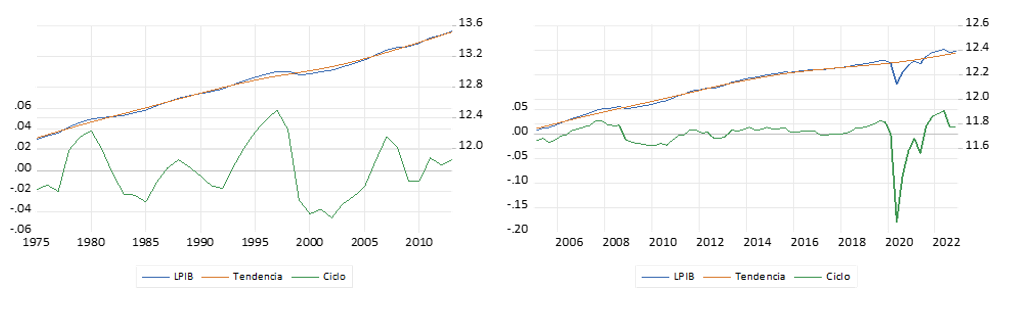
Source: own elaboration.
Taking seasonally adjusted quarterly time series corresponding to the period 2005:1 - 2022:4, the length of the cycle is reduced to 21.7 quarters (5.4 years), the length of the expansionary phase (14.7 quarters on average) is much longer than the contractionary phase (7.0 quarters on average). For example, the contraction of economic activity in the period 2020:1 to 2021:3 as a result of the COVID-19 pandemic is evident, with an output reduction of 7.0% (Table 2).
Table 2
Measuring the economic cycle in Colombia 2005:1-2022:4 (quarterly series)
Cycle (trough to trough in quarters) |
Expansion (quarters) |
Contraction (quarters) |
Ratio Exp/Cont |
||||||
Start |
End |
Duration |
Start |
End |
Duration |
Start |
End |
Duration |
|
2006:1 |
2011:1 |
21 |
2006:1 |
2008:2 |
10 |
2008:3 |
2011:1 |
11 |
0.91 |
2011:1 |
2017:3 |
27 |
2011:1 |
2012:2 |
6 |
2012:3 |
2013:1 |
3 |
2.00 |
2017:3 |
2021:3 |
17 |
2013:2 |
2020:1 |
28 |
2020:1 |
2021:3 |
7 |
4.00 |
Average |
|
21.7 |
|
|
14.7 |
|
|
7.0 |
2.3 |
Stylized facts of the economic cycle in Colombia
Volatility
Volatility corresponds to the quantification of the variability of economic variables measured through the standard deviations of the cyclical components of the time series analyzed. The standard deviation sx of a set of observations of the variable x in the time interval t = 1, 2, ... T is defined in Equation 5:
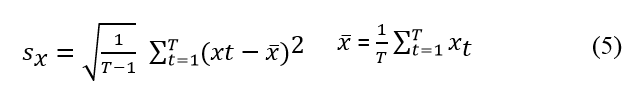
Where: ![]() is the mean value of the observations of xt.
is the mean value of the observations of xt.
Private consumption fluctuates in unison with output, i.e., consumption fluctuations are very similar to output fluctuations. Consumption represents on average 68.5% of the Colombian economy and, according to the data, its growth/decrease depends to a high degree on the expansions/contractions of national production, with a correlation coefficient of 0.90. It is also seen that investment is strongly tied to output growth with a correlation coefficient of 0.79 and that GDP fluctuations are highly influenced by the cyclical behavior of domestic demand rather than by cyclical fluctuations in external demand, with a high correlation between real GDP and imports (0.74) than between GDP and exports (0.32). This suggests, on the one hand, that domestic industry is related to imports of intermediate and capital goods and, on the other hand, that many domestic products have been displaced by foreign manufactures entering the country at lower prices.
Interestingly, employment is more strongly correlated with output (0.72) than unemployment is with output (-0.55). Unemployment fluctuates faster than GDP, but its relationship with GDP is much weaker. A satisfactory explanation could be found in the hysteresis (inertia) of unemployment, which describes the dependence of the natural rate of unemployment on its path over time. According to this theory, unemployment is persistent even when the economic cycle is at its best. It is worth mentioning that unemployment is not entirely cyclical, it is also structural, brought about by technical change and by the progressive substitution of labor for capital in response to the minimization of the average cost of production. In the periods 1975-2013 and 2005:1-2022:4, with the exception of the employment variable, the amplitudes of the fluctuations of the series related to national output (column 3, Table 3) are larger than the amplitude of the fluctuations of GDP.
Table 3
Range of fluctuations in the Colombian economy 1975-2013 and 2005:1-2022:4
Variables (time series) |
Standard deviation of the fluctuations of the series (cycle) |
Ratio of standard deviation of the fluctuations of the series / Standard deviation of GDP |
Cyclical behavior of the series (correlation) |
** Period: 1975 - 2013 |
|||
GDP |
0.026551 |
1.00 |
1.00 |
Consumption (C) |
0.027224 |
1.03 |
0.90 |
*Investment (I) |
0.070655 |
2.66 |
0.79 |
Public expenditure (PE) |
0.033192 |
1.25 |
0.70 |
Exports (X) |
0.064373 |
2.42 |
0.32 |
Imports (M) |
0.135904 |
5.12 |
0.74 |
Domestic demand (C+I+PE) |
0.043149 |
1.63 |
0.91 |
External demand (X+M) |
0.069757 |
2.63 |
0.83 |
Employment |
0.019090 |
0.72 |
0.72 |
Unemployment |
0.147545 |
5.56 |
-0.55 |
*** Period: 2005:1 - 2022:4 |
|||
GDP |
0.028873 |
1.00 |
1.00 |
Consumption (C) |
0.030903 |
1.07 |
0.95 |
*Investment (I) |
0.070034 |
2.43 |
0.89 |
Public expenditure (PE) |
0.021319 |
0.74 |
0.42 |
Exports (X) |
0.071043 |
2.46 |
0.85 |
Imports (M) |
0.083006 |
2.87 |
0.88 |
Domestic demand (C+I+PE) |
0.034452 |
1.19 |
0.97 |
External demand (X+M) |
0.075275 |
2.61 |
0.91 |
Employment |
0.016290 |
0.56 |
0.62 |
Unemployment |
0.054682 |
1.89 |
-0.86 |
GDP deflator |
0.012902 |
0.45 |
0.23 |
Actual salaries |
0.084134 |
2.91 |
0.03 |
Average labor productivity. |
0.107372 |
3.72 |
0.46 |
Nominal short-term interest rate |
0.448802 |
15.54 |
0.43 |
* Corresponds to gross fixed capital formation: housing, other buildings and structures, machinery and equipment, cultivated biological resources and intellectual property products.
** Chained series of volume (retropolated series) of annual frequency with reference year 2015.
*** Chained quarterly frequency volume series with reference year 2015 in the period 2005:1 - 2022:4.
Source: own elaboration.
Visually, the variability of the series analyzed can be better appreciated in Figure 2.
Figure 2
Variable cyclical fluctuations, aggregate demand, employment and unemployment in Colombia 2005:1-2022:4
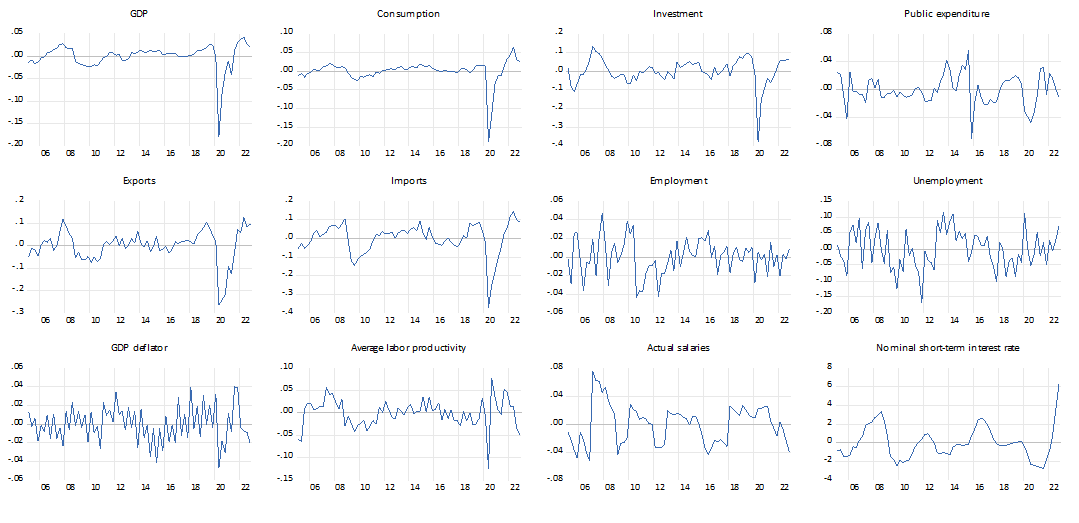
Source: own elaboration.
The analysis of the volatility of the economic cycle in Colombia allows corroborating, initially, three stylized facts or patterns of regular behavior (Romer, 2006), namely: Fact 1: investment is more volatile during the economic cycle than GDP, therefore, this component of aggregate demand is quite unstable. Using annual and quarterly frequency series, it is observed that investment is two and a half times more volatile than GDP, with a high correlation between these two variables (0.79 and 0.89, respectively). Apparently, the entrepreneur, who controls investment decisions that are highly determinant of production and employment, is not guided solely by the interest rate as economic theory suggests, but by a set of expectations about the future, which are generally not incorporated into economic modeling.
Fact 2: foreign trade volumes are between two and three times more volatile than GDP; in the Colombian case they are two and a half times more volatile, in particular, the variability is much higher in the case of imports (inputs and capital goods). Fact 3: Employment and unemployment are considerably less volatile over the business cycle than GDP. In the Colombian business cycle, employment is less volatile than GDP, while unemployment is much more volatile (more than twice that of GDP). Although employment and unemployment should move in unison with the variation of GDP (of course, employment acts in the same direction as GDP and unemployment in the opposite direction), the volatility of unemployment could be related to average labor productivity (four times more volatile than GDP).
Correlation, lead and lag times
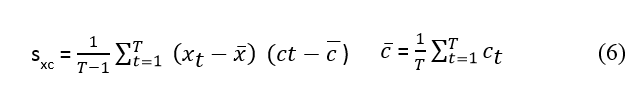
To determine whether the cyclic component xt of an economic variable varies in the same or opposite direction as real GDP (ct), the covariance between xt and ct, which is defined in Equation 6 :
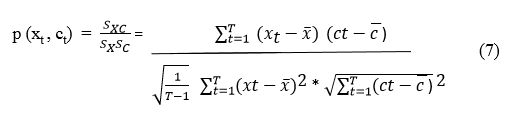
Covariance measures the degree to which x and c vary in unison. By normalizing the observations of xt - and ct - by means of their standard deviations sx and sy and estimate the covariation of standard deviations ![]() , the correlation coefficient between x and c, specified in Equation 7:
, the correlation coefficient between x and c, specified in Equation 7:
Column 4 of Table 3 shows the correlation coefficients between different variables of the Colombian economy and the gross domestic product. The results indicate that the components of aggregate demand in the Colombian economy are procyclical, although some more strongly than others; for example, consumption is mostly correlated with the national product because a large part of the income (wage income par excellence) of households is consumed. Surprisingly, public spending as the usual instrument of Colombian fiscal policy has a procyclical behavior (0.70 in 1975-2013 and 0.42 in 2005:1-2022:4) and not countercyclical as would be expected, since the legislature and the executive establish its composition and annual amount in the nation's general budget. In this sense, countercyclical public spending is useful for reducing the duration and intensity of recessions (smoothing the cycle) and offsetting the procyclical behavior of private sector spending. This is explained by the reduced discretion of current governments in the programming of current spending (especially public servants' payroll and debt service), which, according to the tax experts, is inflexible in a high proportion. In Colombia, it is common for each government in office, regardless of political affiliation, to implement tax reforms based on the reduction of the fiscal deficit, the sustainability of the public debt and the balance of public finances.
Three additional stylized facts will be corroborated below, as follows: Fact 4: private consumption, investment and imports show a close positive correlation with GDP. Indeed, private consumption is the variable most correlated with GDP (0.90 in 1975-2013 and 0.95 in 2005:1-2022:4) and investment and imports above 80%, especially in the period 2005:1-2022:4). Fact 5: employment is procyclical (0.62) and unemployment is countercyclical (-0.86) with a closer correlation with GDP than real wages (0.03) and labor productivity (0.46). Labor productivity tends to be procyclical, while real wages tend to be weakly correlated with GDP and Fact 6: In most countries, inflation tends to be positively correlated with GDP, although the correlation is not very strong (0.23). Inflation was estimated using the implicit GDP deflator as a more accurate measure of the general price level rather than the consumer price index (CPI) which measures a restricted basket of goods and services.
Consumption and investment as constituent elements of effective demand are highly procyclical with a correlation coefficient of 0.95. It is common to observe that when national income rises, household consumption also rises and investment increases in the economic expansion phase due to entrepreneurs' optimism. This explains the investment correlation coefficient of 0.89. Furthermore, it can be seen that the fluctuations of exports and imports are strongly correlated with the output cycle, exports depend on the import of intermediate goods and capital goods, but if we take the balance of net exports they become countercyclical with -0.29 due to the deficit level of the trade balance.
Scholars of the real business cycle theory (neoclassical economists) argue that the main cause of business cycles reflected in the shifts of aggregate supply functions are technological shocks, i.e., variations in total factor productivity that explain about 70% of the amplitude of GDP fluctuations (Díaz, 1999). If this theory is correct, the GDP deflator should be countercyclical (with a negative sign). In the Colombian case, the GDP deflator presents a positive correlation coefficient of 0.23 (procyclical), a result that suggests that the main cause of economic cycles in Colombia could be due to shifts in the aggregate demand function as a consequence of shocks affecting domestic demand, such as private consumption expenditure, investment and public expenditure.
Keynesian theory focuses the explanation of economic crises such as the Great Depression of the 1930s on the insufficiency of effective demand (Keynes, 2003) and not on the increase in aggregate supply , as Say (2001) argued in his famous law. This ideological position is more inclined towards the reduction of production costs, the increase of average labor productivity and total factor productivity. The positive value of the correlation coefficient of the GDP deflator in the Colombian economy in the period 2005:1-2022:4, would indicate that the cyclical fluctuations that positively or negatively affect employment/unemployment are explained to some extent by shifts in the aggregate demand function contrary to the postulates of the dominant theory that explains that shifts in the aggregate production function are the main cause of the fluctuations.
If this result is valid, the smoothing of the Colombian economic cycle should be executed through countercyclical monetary and fiscal policies, prioritizing the constitution of macroeconomic stabilization funds, controlling public spending as an exogenous variable and contracting consumption and investment through the intervention interest rate set by Banco de la República. This is precisely what the central bank has done since 1991 in strict compliance with its constitutional function.
Regarding the labor market, employment is procyclical with 0.62 (it generally increases during expansions and decreases during recessions); while unemployment is countercyclical with a correlation coefficient of -0.86. It follows that the cyclical behavior of employment is not as strong in its relationship with the cyclical behavior of output; one would expect employment to be more closely tied to GDP; that is, employment to be more dependent on economic growth (Sorensen & Whitta, 2008). As for unemployment, the relationship is much stronger (close to -1) although it should be noted that unemployment in Colombia suffers from hysteresis, only a part of unemployment is reduced in economic expansions, a situation that is observed when comparing the amplitude of the unemployment cycle of 2.53 with the amplitude of the GDP cycle of 1.34, the difference being almost twice.
Persistence
Persistence in a time series (xt)t=1 is measured by calculating the correlation coefficient between xt and its own lagged value xt-n for n = 1, 2, ... T. If the autocorrelation coefficient p(xt, xt-n) is significantly greater than zero for positive values of n, there is a high degree of persistence, i.e., when x has increased or decreased with respect to its mean value, it tends to continue to be higher or lower than its mean value over a long period of time (Sorensen & Whitta, 2009). Taking the data in Table 4, the first figure (0.72) in the fifth column means that if Colombia's real GDP increases by one percentage point in one year, 0.72 percentage points on average of that increase will remain in the following year, provided that the economy does not suffer shocks. In general, changes in GDP, private consumption, investment and public spending are considerably persistent. The considerable persistence of employment in Colombia may be due to the fact that employers are reluctant to hire and fire workers because of high on- and off-boarding costs. The same is true of the high persistence of unemployment that ends up increasing labor informality.
The fluctuations of consumption, investment and imports (0.96, 0.88 and 0.87, respectively) are roughly coincident with those of GDP at zero lag, while exports are lagged one and two years; in contrast, government spending is lagged one, two and three periods. Employment lags by one period and unemployment lags by one, two and three periods.
Table 4
Deviations of the deviations of the aggregate demand, employment and unemployment series in Colombia 1975-2013 and 2005:1-2022:4
Variables |
**Period: 1975 - 2013 |
||||||
X (t-3) |
X (t-2) |
X (t-1) |
X (t) |
X (t+1) |
X (t+2) |
X (t+3) |
|
GDP |
-0.15 |
0.28 |
0.74 |
1.00 |
0.72 |
0.23 |
-0.20 |
Consumption (C) |
0.91 |
0.90 |
0.90 |
0.96 |
0.91 |
0.90 |
0.90 |
*Investment (I) |
0.79 |
0.79 |
0.79 |
0.88 |
0.78 |
0.78 |
0.78 |
Public expenditure (PE) |
0.70 |
0.70 |
0.70 |
0.80 |
0.70 |
0.70 |
0.70 |
Exports (EX) |
0.32 |
0.32 |
0.32 |
0.10 |
0.34 |
0.34 |
0.32 |
Imports (IM) |
0.74 |
0.74 |
0.74 |
0.87 |
0.73 |
0.73 |
0.73 |
Domestic demand (C+I+PE) |
0.91 |
0.91 |
0.91 |
0.97 |
0.91 |
0.91 |
0.91 |
External demand (X+M) |
0.83 |
0.83 |
0.83 |
0.88 |
0.83 |
0.83 |
0.83 |
Employment |
0.74 |
0.73 |
0.73 |
0.78 |
0.72 |
0.72 |
0.74 |
Unemployment |
-0.55 |
-0.55 |
-0.55 |
-0.52 |
0.54 |
-0.55 |
-0.55 |
***Period: 2005:1 - 2022:4 |
|||||||
GDP |
-0.54 |
0.13 |
0.68 |
1.00 |
0.76 |
0.22 |
-0.57 |
Consumption (C) |
0.95 |
0.95 |
0.95 |
0.95 |
0.95 |
0.95 |
0.95 |
*Investment (I) |
0.89 |
0.88 |
0.89 |
0.89 |
0.89 |
0.89 |
0.90 |
Public expenditure (PE) |
0.42 |
0.43 |
0.43 |
0.42 |
0.43 |
0.44 |
0.44 |
Exports (X) |
0.85 |
0.85 |
0.85 |
0.85 |
0.85 |
0.85 |
0.85 |
Imports (M) |
0.88 |
0.88 |
0.88 |
0.88 |
0.88 |
0.88 |
0.88 |
Domestic demand (C+I+PE) |
0.97 |
0.97 |
0.97 |
0.97 |
0.97 |
0.97 |
0.97 |
External demand (X+M) |
0.90 |
0,91 |
0.91 |
0.91 |
0.91 |
0.91 |
0.91 |
Employment |
0.61 |
0,61 |
0.62 |
0.62 |
0.62 |
0.62 |
0.63 |
Unemployment |
-0.86 |
-0.86 |
-0.86 |
-0.86 |
-0.86 |
-0.86 |
-0.87 |
GDP deflator (inflation) |
0.26 |
0.27 |
0.25 |
0.23 |
0.23 |
0.23 |
0.23 |
Actual salaries |
0.06 |
0.05 |
0.04 |
0.03 |
0.03 |
0.03 |
0.01 |
Average labor productivity |
0.49 |
0.49 |
0.47 |
0.45 |
0.46 |
0.46 |
0.47 |
Nominal short-term interest rate |
0.43 |
0.45 |
0.44 |
0.43 |
0.43 |
0.43 |
0.43 |
* Corresponds to gross fixed capital formation: housing, other buildings and structures, machinery and equipment, cultivated biological resources and intellectual property products.
** Chained series of volume (retropolated series) of annual frequency with reference year 2015.
*** Chained quarterly frequency volume series with reference year 2015 in the period 2005:1 - 2022:4.
Source: own elaboration.
From the above information, Fact 7 is corroborated, employment is a lagged variable, nominal short-term interest rates also tend to be lagged variables. Employment does not respond immediately to changes in national output, it takes at least one quarter to react and short-term interest rates at least three quarters. It could be said that the behavior of the entrepreneur based on expectations prevents him from acting de facto, simply because interest rates have decreased and, consequently, credit is cheaper. This evidence shows that economic policy has internal and external lagged effects on the economic system; for example, the effects of monetary policy can take up to two years to materialize (Sorensen & Whitta, 2009). In conclusion, Fact 8: GDP is persistent and private consumption shows a higher degree of persistence. Empirical evidence in Colombia indicates that private consumption has a considerable level of persistence three quarters backward and forward. The same is true for private investment and imports, given that domestic industry depends on foreign manufactured intermediate goods. Finally, Fact 9: employment and unemployment are even more persistent than GDP. Unemployment is more persistent than employment, in particular, three quarters backward and employment two quarters forward (Table 4).
The analysis with quarterly time series corresponding to the period 2005:1-2022:4, suggests that consumption, investment, imports and exports (0.95, 0.89, 0.88 and 0.85, respectively) are coincident with those of GDP at time zero; that is, it acts quickly; while employment and unemployment are delayed by three quarters and the GDP deflator is advanced by two quarters. The advances and delays in the cyclical behavior of the series examined do not follow a certain pattern; for example, effective demand (consumption plus investment) acts faster, since decisions are made by private agents, while public spending takes longer to take effect due to delays in the approval and execution of the public budget and fiscal reforms (tax reforms, financing law, etc.). Contradictorily, in some expansionary phases of the cycle, jobs have been destroyed, while in some recessionary phases, jobs have been created. The number of jobs created (776,859 jobs) in the period 2001:1-2021:3 is much lower than the number of jobs destroyed (2,146,483 jobs). A large number of them were lost in 2020 due to the COVID-19 pandemic, whose economic and social impact was devastating.
In the information available in Table 5, the cyclical fluctuations in the period in reference are analyzed from economic and labor statistics of quarterly frequency, as suggested by the literature specialized in the economic cycle theory. It is shown that employment and its counterpart, unemployment, do not depend entirely on economic growth. Unemployment is a highly complex phenomenon, and despite the innumerable studies to which it has been subjected, today the questions outweigh the answers and the challenges become more diffuse.
Table 5
Balance in the generation of employment in Colombia 2001:1-2021:3
Period (quarter) |
Phase of the economic cycle |
UR (%) |
ER (%) |
Employed (%) |
Unemployed (%) |
Number of jobs created |
Number of jobs destroyed |
Balance |
2001:1 |
Peak |
-3.6 |
0.4 |
1.0 |
-3.2 |
-146.453 |
76.815 |
-69.638 |
2002:3 |
Trough |
2.7 |
0.4 |
0.1 |
3.4 |
183.281 |
45.282 |
228.563 |
2003:1 |
Peak |
6.5 |
-1.6 |
-1.7 |
5.7 |
282.759 |
-542.685 |
-259.926 |
2003:3 |
Trough |
-7.0 |
1.1 |
1.5 |
-6.7 |
-348.110 |
481.326 |
133.216 |
2004:1 |
Peak |
3.3 |
-1.8 |
-1.9 |
1.8 |
91.826 |
-621.329 |
-529.503 |
2004:3 |
Recession |
-2.1 |
0.3 |
0.5 |
-2.0 |
18.395 |
243.205 |
261.600 |
2006:1 |
Recession |
-2.5 |
0.0 |
0.7 |
-2.2 |
-92.459 |
233.087 |
140.628 |
2006:3 |
Expansion |
-1.7 |
0.4 |
0.8 |
-1.1 |
-9.580 |
545.056 |
535.476 |
2008:4 |
Recession |
0.2 |
0.5 |
1.0 |
1.1 |
35.913 |
141.838 |
177.751 |
2011:3 |
Peak |
0.7 |
0.5 |
0.8 |
1.6 |
-23.895 |
373.517 |
349.622 |
2012:3 |
Recession |
0.7 |
-0.4 |
-0.2 |
0.6 |
52.367 |
-466.574 |
-414.207 |
2013:2 |
Expansion |
-0.4 |
0.1 |
0.5 |
0.0 |
76.661 |
221.132 |
297.793 |
2017:1 |
Recession |
-0.4 |
-0.1 |
0.3 |
-0.1 |
176.419 |
-417.258 |
- 240.839 |
2018:2 |
Expansion |
4.4 |
-1.5 |
-1.0 |
3.9 |
584.376 |
-159.644 |
424.732 |
2020:2* |
Recession |
-6.5 |
2.2 |
2.5 |
-5.4 |
-168.435 |
-2.096.085 |
-2.264.520 |
2021:3 |
Expansion |
-1.0 |
0.0 |
0.2 |
-0.9 |
63.794 |
- 204.166 |
-140.372 |
Total |
776.859 |
- 2.146.483 |
- 1.369.624 |
|||||
* COVID-19 pandemic
UR (%): Percentage change in unemployment rate; ER (%): Percentage change in employment rate.
Source: Prepared by the authors based on DANE labor statistics 2001:1-2021:3.
Conclusions
Cyclical fluctuations in employment and unemployment are quite closely related to effective demand and domestic demand variables, as emphasized by Keynesian theory. The positive correlation between the cyclical fluctuations of GDP and the cyclical behavior of the GDP deflator suggests that the economic cycle in Colombia is not due to shifts in the aggregate production function, as predicted by mainstream economic theory, but to shifts in the aggregate demand function.
Cyclical fluctuations in employment and unemployment are more delayed than fluctuations in output. The considerable persistence in this type of variables may be an effect of labor market rigidities due to the high costs of hiring and firing that cause employers to take longer to adjust their workforces. However, this hotly debated topic requires a more detailed analysis that is beyond the scope of this article.
The decomposition and analysis of the economic cycle in Colombia is of utmost importance to understand that for several decades the national government has applied pro-cyclical policies that have been ineffective in dealing with recurrent economic crises with modest effects on employment generation and the quality of employment. We observe a contraction of public spending in recessionary phases and an increase in spending in expansionary phases, contrary to the recommendations of Keynesian theory that suggest increasing public spending during recessions to stimulate productive activity and reducing public spending during expansions as a fiscal stabilization measure.
In the Colombian case, the GDP deflator presents a positive correlation coefficient of 0.23 (procyclical), a result that suggests that the main cause of economic cycles could be due to shifts in the aggregate demand function as a consequence of shocks affecting domestic demand, such as: consumption expenditure, investment and public expenditure. This empirical evidence is diametrically opposed to the neoclassical theory that economic fluctuations are caused by technological shocks, although in the specialized literature, the most frequently cited example is the oil crisis of the 1970s. It seems that the list of examples of supply shocks is quite restricted, a situation that raises more questions than answers about the theory of the business cycle.
The empirical evidence examined shows compliance with the stylized facts of the economic cycle in Colombia. However, the cyclical fluctuations of employment and unemployment, despite their strong correlation with the GDP cycle, indicate that there is no absolute guarantee that in the expansion phase of economic activity employment is generated and that during the contraction phase part of the employment is destroyed. Unemployment in Colombia suffers from hysteresis; added to this, the existence of an inconsistent empirical relationship between real GDP and unemployment makes the design of an effective labor policy more difficult.
This research provides empirical evidence that characterizes the economic cycles in Colombia, showing the fulfillment of certain regularities or patterns present in both developed and developing economies. It is hoped that the results described here may support a better understanding of the functioning of the Colombian economy and motivate applied macroeconomic research.
Ethical considerations
This research did not require ethical endorsement because it was based on documentary review and analysis of freely available official statistics published on the website of the National Administrative Department of Statistics (DANE).
Conflict of interest
All authors made significant contributions to the document and declare that there is no conflict of interest related to the article.
Source of financing
This research was financed with the author's own resources. It was not sponsored by any public or private institution.
It corresponds to the potential GDP that an economy would reach under a situation of full employment.
Values in parentheses correspond to standard errors.
In reality, no economist is able to know with certainty the quantity of productive factors available in the economy, nor their rate of utilization at the aggregate level.
Marx calls the economic cycle a recurrent economic crisis in the system of capitalist accumulation as a consequence of the contradiction existing between the production of exchange values and use values, which is expressed in the overproduction of merchandise that the capacity of national and foreign consumers cannot absorb despite the massive use of advertising, which far from being informative has proven to be deceitful and manipulative. For Marx, the limit of capital is the same capital that creates internal barriers to economic expansion.
References
(1)Burns, A. F. & Wesley, C. M. (1946). Measuring Business Cycles. National Bureau Of Economic Research. https://libarch.nmu.org.ua/bitstream/handle/GenofondUA/22857/c4dc124ce403e99725fabe41ef7d1d95.pdf?sequence=1
(2)Departamento Administrativo Nacional de Estadística. (DANE). (2020). Dirección de síntesis y cuentas nacionales. Retropolación base 2015. https://www.dane.gov.co/files/investigaciones/boletines/pib/cuentas-nal-anuales/retropolacion/nota-metodologica-retropolacion-base-2015.pdf
(3)Díaz, J. (1999). Macroeconomía: primeros conceptos. Antoni Bosch editor.
(4)Diebold, F. X. & Rudebusch, G. D. (1996). Measuring business cycles: A modern perspective. MIT: The Review of Economics and Statistics, 78(1), 67-77.
(5)Escobar, A. A. (2005). Los ciclos económicos en Colombia. Repositorio Fedesarrollo. https://www.repository.fedesarrollo.org.co/bitstream/handle/11445/907/Co_Eco_Diciembre_2005_Escobar.pdf?sequence=2&isAllowed=y
(6)Gómez, B. R. (2008). La teoría del ciclo económico en Friedrich von Hayek: Causas monetarias, efectos reales. Cuadernos de Economía, 27(48), 47-69.
(7)Guerrero, D. (2011). Sismondi, Precursor de Marx. Maia Editores.
(8)Jimeno, J. F. (2016). Crecimiento y empleo. Una relación turbulenta e incomprendida. RBA Libros S.A.
(9)Keynes, J. M. (2003). Teoría general de la ocupación, el interés y el dinero (E. Hornedo, Trad.; 4. a ed.). Fondo de Cultura Económica. (Trabajo original publicado en 1936).
(10)Kydland, F. & Prescott, E. C. (1990). Business Cycles: Real Facts and a Monetary Myth. Federal Reserve Bank of Minneapolis, 14(2), 3-18. https://doi.org/10.21034/qr.1421
(11)Kydland, F. E. & Prescott, E. C. (1982). Time to build and aggregate fluctuations. Econometrica, 50(6), 1345-1370. https://doi.org/10.2307/1913386
(12)Hodrick, R. J. & Prescott, E. C. (1997). Postwar U.S. Business Cycles: An Empirical Investigation. Journal of Money, Credit and Banking, 29(1), 1-16.
(13)Kondratieff, N. (1944). Los grandes ciclos de la vida económica. En Gottfried. H. Ensayos sobre el ciclo económico. Fondo de Cultura Económica. (Trabajo original publicado en 1926).
(14)Long, J. B. & Plosser, C. I. (1983). Real Business Cycles. Journal of Political Economy, 91(1), 39-69.
(15)Lora, E. y Prada, S. (2016). Técnicas de medición económica. Metodología y aplicaciones en Colombia (5.a ed.). Universidad ICESI.
(16)Lucas, R. E. (1977). Carnegie-Rochester Conferencia Series on Public Policy. En K. Brunner y A. H. Meltzer (eds.), Understanding Business Cycles (pp. 7-29).
(17)Mandel, E. (1998). Las ondas largas del desarrollo capitalista. La interpretación marxista. Siglo XXI Editores (Trabajo original publicado en 1980).
(18)Marshall, A. (1948). Principios de economía. (E. Figueroa, Trad.) Editorial Síntesis (Trabajo original publicado en 1890).
(19)Marx, C. (2017). El capital: Crítica de la economía política Tomo II (W. Roces, Trad. 4.a ed.). Fondo de Cultura Económica (Trabajo original publicado en 1885).
(20)Okun, A. M. (1962). Potential GNP: Its Measurement and Significance. American Statistical Association: Proceedings of the Business and Economic Statistics Section.
(21)Parra, J. C. (2008). Hechos estilizados de la economía colombiana: fundamentos empíricos para la construcción y evaluación de un modelo DSGE. Borradores de Economía Banco de la República, (509), 1-47. https://doi.org/10.32468/be.509
(22)Rodríguez, V. J. (2005). La nueva fase del desarrollo económico y social del capitalismo mundial [Tesis de doctorado, Universidad Nacional Autónoma de México] Eumed.
(23)Romer, D. (2006). Macroeconomía avanzada (G. Trinidad, Trad.; 3.a ed.). Mc Graw Hill. (Trabajo original publicado en 2006).
(24)Say, J. B. (2001). Tratado de economía política (J. S. Rivera, Trad.; 1.aed.). Fondo de Cultura Económica. (Trabajo original publicado en 1841).
(25)Schumpeter, J. A. (1939). Business Cycles: A Theoretical, Historical, and Statistical Analysis of the Capitalist Process. McGraw-Hill Book Company.
(26)Schumpeter, J. A. (2015). Capitalismo, socialismo y democracia (J. D. Limeres, Trad.). Página Indómita. (Trabajo original publicado en 1943).
(27)Snowdon, B. & Vane, H. R. (1999). Conversations with leading economists: Interpreting modern macroeconomics. Edward Elgar Pub.
(28)Solow, R. M. (1956). A contribution to the theory of economic growth. The Quarterly Journal of Economics, 70(1), 65-94. https://doi.org/10.2307/1884513
(29)Solow, R. M. (1957). Technical change and the aggregate poduction fuction. The Review of Economics and Statistics, 39(3), 312-320. https://doi.org/10.2307/1926047
(30)Sorensen, P. B. & Whitta, H. J. (2009). Introducción a la macroeconomía avanzada. Volumen II: Ciclos económicos (E. Rabasco, Trad.; 1.a ed.). Mc Graw Hill / Interamericana de España. (Trabajo original publicado en 2005).
(31)Sorensen, P. B. & Whitta, H. J. (2008). Introducción a la macroeconomía avanzada. Volumen I: Crecimiento económico. (E. Rabasco, Trad.; 1.a ed.). Mc Graw Hill (Trabajo original publicado en 2005).
(32)Hayek, F. (1996). Precios y producción. Una explicación de las crisis de las economías capitalistas (C. R. Braun, Trad.; 1.a ed.). Ediciones Acosta. (Trabajo original publicado en 1931).
Annexes
Annex 1
Output of estimated results of the Okun's Law model Colombia 1980-2022 (in annual growth rates)
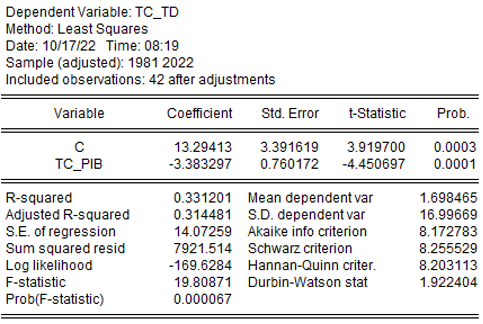
Source: own elaboration.
Annex 2
Output estimated model Okun's Law Colombia 2001:1-2022:4 (in annual growth rates)
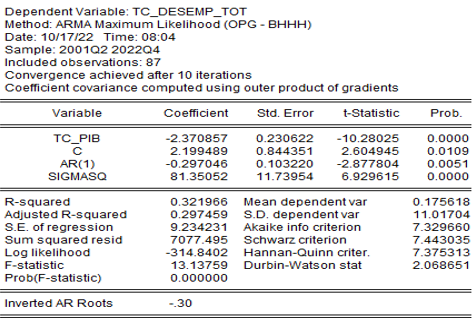
Source: own elaboration.
How to cite this article: Hidalgo, M. (2024). Business cycles in Colombia: stylized facts. Tendencias, 25(2), 26-56. https://doi.org/10.22267/rtend.242502.253