https://doi.org/10.22267/rtend.252602.274
Research Article
Finance
Application of the Treynor index in SMEs in the Colombian logistics sector period: 2019-2023
Aplicación del índice de Treynor en pymes del sector logístico colombiano periodo: 2019-2023
Aplicação do índice de Treynor nas PYME do sector logístico colombiano período: 2019-2023
Por:1Daniel Isaac Roque![]() ; 2Andrés Caicedo Carrero
; 2Andrés Caicedo Carrero![]() ;
;
![]()
1 Master’s in Accounting, University of Havana, Cuba. Research professor at the School of Business, Fundación Universitaria Konrad Lorenz. ORCID: 0000-0002-7536-025X. E-mail: daniel.isaacr@konradlorenz.edu.co. Bogotá, Colombia.
2Master’s in Finance, Universidad Externado de Colombia. Research professor at the Faculty of Business Sciences, Corporación Universitaria Iberoamericana. ORCID: 0000-0001-7749-684X. E-mail: andres.caicedo@docente.ibero.edu.co. Bogotá, Colombia.
Received:March 19, 2025 Accepted:June 11, 2025
DOI: https://doi.org/10.22267/rtend.252602.274
How to cite this article: Roque, D., Caicedo, A., & Quintero, O. (2025). Application of the Treynor index in SMEs in the Colombian logistics sector period: 2019–2023. Tendencias, 26(2), 27-54. https://doi.org/10.22267/rtend.252602.274
![]()
Abstract
Introduction: In Colombia, small and medium-sized enterprises (SMEs) operate in a volatile economic environment, which exposes them significantly to systematic risk. Therefore, it is crucial to have tools to evaluate their risk-adjusted financial performance. Objective: To analyze the viability of the Treynor index as a tool for measuring risk compensation in SMEs in the freight forwarding sector. Methodology: through a quantitative approach, financial data from 59 representative companies were examined, using regression models with fixed and random effects, as well as hypothesis testing. Results: the results indicate that, on average, the profitability of these SMEs does not adequately compensate the systematic risk to which they are exposed. However, it was found that the Treynor index can be adapted to the specific characteristics of the logistics sector, suggesting its usefulness as a risk management tool. Conclusion: Moving the use of the Treynor index from market finance to corporate finance constitutes a valid alternative to improve the financial competitiveness of Colombian logistics SMEs, by providing an objective way of evaluating the relationship between risk and profitability.
Keywords: financial management; correlation; profit; risk management; return.
JEL: C12; C23; F65; G30; G32
Resumen
Introducción: en Colombia, las pequeñas y medianas empresas (pymes) operan en un entorno económico volátil, lo que las expone significativamente al riesgo sistemático. Por ello, es crucial contar con herramientas que permitan evaluar su desempeño financiero ajustado al riesgo. Objetivo: Analizar la viabilidad del índice de Treynor como herramienta de medición de la compensación del riesgo en pymes del sector de agentes de carga. Metodología: a través de un enfoque cuantitativo, se examinaron datos financieros de 59 empresas representativas, utilizando modelos de regresión con efectos fijos y aleatorios, además de pruebas de hipótesis. Resultados: los resultados indican que, en promedio, la rentabilidad de estas pymes no compensa adecuadamente el riesgo sistemático al que están expuestas. No obstante, se evidenció que el índice de Treynor puede adaptarse a las características específicas del sector logístico, lo que sugiere su utilidad como herramienta de gestión del riesgo. Conclusión: trasladar el uso del índice de Treynor desde las finanzas de mercado hacia las finanzas corporativas, constituye una alternativa válida para mejorar la competitividad financiera de las pymes logísticas colombianas, al proporcionar una forma objetiva de evaluar la relación entre riesgo y rentabilidad.
Palabras clave: administración financiera; correlación; ganancia; gestión del riesgo; rendimiento.
JEL: C12; C23; F65; G30; G32
Resumo
Introdução: Na Colômbia, as pequenas e médias empresas (PMEs) operam em um ambiente econômico volátil, o que as expõe significativamente ao risco sistemático. Portanto, é fundamental ter ferramentas para avaliar seu desempenho financeiro ajustado ao risco. Objetivo: analisar a viabilidade do índice Treynor como uma ferramenta para medir a compensação de riscos em PMEs do setor de agenciamento de cargas. Metodologia: usando uma abordagem quantitativa, os dados financeiros de 59 empresas representativas foram examinados usando modelos de regressão de efeitos fixos e aleatórios e testes de hipóteses. Resultados: os resultados indicam que, em média, a lucratividade dessas PMEs não compensa adequadamente o risco sistemático ao qual estão expostas. No entanto, verificou-se que o índice de Treynor pode ser adaptado às características específicas do setor de logística, o que sugere sua utilidade como ferramenta de gerenciamento de risco. Conclusão: Transferir o uso do índice de Treynor das finanças de mercado para as finanças corporativas é uma alternativa válida para melhorar a competitividade financeira das PMEs de logística colombianas, fornecendo uma maneira objetiva de avaliar a relação entre risco e retorno.
Palavras-chave: gestão financeira; correlação; lucro; gestão de riscos; retorno.
JEL: C12; C23; F65; G30; G32
Introduction
The Colombian logistics sector plays a critical role in the country’s economic and social development, acting as a key enabler of international trade and as a strategic component in the integration of global value chains (World Economic Forum, 2020). Its relevance has grown in recent years due to the sustained expansion of non-traditional exports and the implementation of multiple free trade agreements that have bolstered Colombia’s competitiveness in international markets (Gutiérrez et al., 2019).
Freight forwarders, as part of this sector, are essential actors in the global trade ecosystem. They provide customized and efficient logistics solutions tailored to diverse market demands. According to Meyer and Clausen (2006), freight forwarders play a vital role throughout the product lifecycle by enhancing economic efficiency, quality, and customer service. These firms are part of a vast network encompassing transportation and logistics companies that oversee planning, monitoring, and control of material flows across supply, production, and distribution stages, as well as waste management (Mateus et al., 2023).
In Colombia, freight forwarders offer comprehensive logistics services, including full or consolidated cargo transportation, customs brokerage, warehousing, distribution, and consultancy. However, the 2022 National Logistics Survey reported a significant increase in operating costs, driven by: (i) rising toll and fuel prices, (ii) currency exchange volatility, (iii) changes in tax regulations, and (iv) limited access to financing. These factors have heightened the sector’s exposure to economic volatility, negatively impacting financial performance.
A company’s financial performance serves as a comprehensive indicator of its economic health, reflecting its ability to mobilize and allocate resources efficiently. As Yunus and Lukum (2021) note, key indicators include capital coverage, liquidity, and profitability. These metrics not only represent the current status of a company but also offer insights into how effectively it is utilizing available resources to achieve its strategic objectives (Wani & Dar, 2015).
In an environment characterized by ongoing transformations, financial performance measurement becomes a cornerstone of business sustainability. Evaluating metrics such as profitability, growth, and shareholder wealth maximization is essential for assessing whether investors are being adequately compensated for their risk exposure and for guiding strategic decision-making (Roque & Carrero, 2021a; Susanti & Restiana, 2018).
From a financial perspective, the risk-return relationship requires careful attention, as risk behavior directly affects company performance (Kristjanpoller & Morales, 2011; Faiteh & Aasri, 2022). Consequently, the academic literature offers various approaches to measuring financial performance and its association with risk (Atmaca, 2022).
Among the most widely used metrics are Jensen’s Alpha, the Treynor Index, the Sharpe Ratio, the Modigliani-Modigliani (M²) Index, the Sortino Ratio, the Information Ratio (IR), the Omega Ratio, and the Kappa Ratio (Pesce et al., 2018). The Treynor Index stands out due to its precise ability to capture performance per unit of systematic risk, making it a superior tool in certain contexts (Qur’anitasari et al., 2019).
The Treynor Index is used to evaluate risk-adjusted performance in the stock market. Its purpose is to rank assets according to their ability to compensate for risk, linking portfolio performance to the level of risk assumed (Hertina et al., 2021; Pilotte & Sterbenz, 2006). It measures the additional return earned compared to a risk-free investment that is not exposed to diversifiable systematic risk (Tajdini et al., 2021). The Treynor Index is a widely used investment analysis tool that helps determine whether a portfolio outperforms or underperforms the market average (Lekovic, 2017).
Unlike other indicators that consider the total volatility of a portfolio, the Treynor Index focuses on systematic risk—risk that cannot be eliminated through diversification and is tied to general market movements (Bacon, 2023). This index uses beta as a measure of systematic risk and allows for evaluating a portfolio’s efficiency in relation to the risk undertaken (Halim et al., 2020). This logic is particularly useful in markets where systemic risks are unavoidable, and where privately held firms seek strategic positioning without access to broad diversification options. In contrast to other metrics that account for both systematic and unsystematic risk (such as the Sharpe ratio or the M² measure), the Treynor Index concentrates on what is essential: return in relation to unavoidable risk (Lo, 2002). This characteristic gives it an advantage when evaluating a company’s intrinsic efficiency in responding to market fluctuations.
Despite the widespread use of the Sharpe ratio, its reliance on total risk (standard deviation) introduces bias when analyzing SMEs, where unsystematic risk tends to be high and difficult to diversify. While the M² ratio improves upon the Sharpe ratio’s interpretation, it inherits the same limitation. Other metrics, such as the Information Ratio, Omega Ratio (Van Dyk et al., 2014), and Kappa Ratio (Auer, 2015), offer greater technical depth but pose methodological complexity, which may become a practical barrier for SMEs that often operate with limited analytical resources (Ferson, 2013).
In this regard, the simplicity and focus of the Treynor Index make it attractive, as it does not require complex assumptions, is intuitive, and can be easily adapted to systematic risk assessment frameworks. Furthermore, it allows for direct comparison of different projects or portfolios based on their performance relative to the market, which is especially useful in volatile sectors or those heavily exposed to economic cycles (DeBoeuf et al., 2013). While it is advisable to complement the Treynor Index with additional tools that capture specific business characteristics, its ability to translate systematic risk into an interpretable value makes it a viable metric for implementation in SMEs (Pavláková & Kocmanová, 2018; Soekarno et al., 2020; Zaato et al., 2020).
In recent years, various studies in capital markets have demonstrated the viability of using the Treynor Index as a risk-adjusted performance metric. For example, Lu et al. (2021) employed Treynor-based metrics to assess systematic risk. Their findings confirmed that this index produces measurements consistent with other risk models, making it useful for managing diversified portfolios. The study concluded that the Treynor Index is feasible in developed markets with stable and predictable economic conditions.
Another study by Atmaca (2022) applied the Treynor Index in Turkey’s energy sector to optimize portfolios in a volatile environment. Results indicated that, while traditional portfolio management tools are useful, the Treynor Index offers a specific advantage due to its exclusive focus on systematic risk, positioning it as an effective tool in volatile sectors such as energy.
Mohan et al. (2022) conducted a study in India’s renewable energy networks sector using a Treynor-based model. The results showed that the application of the Treynor Index facilitates the construction of more robust portfolios, increases the share of renewable energy assets, and keeps risk levels below those of the market portfolio. The study concluded that the Treynor Index is a powerful tool for energy investment decisions guided by sustainability and economic efficiency criteria.
Research by Pavic et al. (2023), conducted in the Croatian financial sector, used the Treynor Index to analyze publicly traded firms. The results indicated that factors such as firm size, profitability, and leverage levels significantly influence risk-adjusted financial performance. The study concluded that the Treynor Index is a valid tool for investment evaluation in emerging markets, provided that sectoral context and specific financial characteristics are considered.
The study by Jana et al. (2024) applied the Treynor Index to fuzzy multi-objective portfolios to enhance diversification and risk-adjusted returns. The results showed that this approach reduces systematic risk and optimizes portfolio composition. Their findings confirm the Treynor Index’s viability as a practical tool in emerging markets with complex economic dynamics.
The study by Manap et al. (2024) evaluated the financial performance of investment firms in Indonesia using the Treynor-Black method, which combines portfolios with high alpha relative to the market. The results highlight that this method enhances risk-adjusted performance metrics, demonstrating its viability for portfolio optimization in diversified investment sectors and emerging markets.
The specialized literature recognizes the Treynor Index as a robust tool for assessing systematic risk-adjusted returns across various sectors and regions. Its usefulness is particularly notable in emerging and volatile markets, where it effectively captures systematic risk. In this regard, studies conducted in the energy, financial, and investment sectors have shown that this metric facilitates portfolio management and provides valuable information for decision-making in environments marked by macroeconomic variability.
Given the current context of the Colombian economy—characterized by economic fluctuations, increasing global integration, and the lingering effects of the COVID-19 pandemic—the Treynor Index emerges as a useful alternative for evaluating systematic risk management in the country’s small and medium-sized enterprises. This study offers a distinct perspective from previous research by applying this metric to privately held companies, where financial information tends to be limited. Accordingly, the objective of this research is to adapt the Treynor Index—traditionally used in stock markets—as a tool for measuring risk compensation in SMEs within the freight forwarding sector.
Methodology
This study employed a quantitative, exploratory research design aimed at generating potential responses to identified problems and formulating testable hypotheses relevant to the examined scenario (Maldonado, 2018). For the selection of firms included in the sample, the primary criterion was the availability of financial information reported to the Integrated Business Information System (SIIS), managed by Colombia’s Superintendency of Companies, covering the period from 2019 to 2023. Based on the collected data, a total of 59 companies that disclosed financial statements during the study period were identified.
After defining the representative sample, the Treynor Index was calculated based on the structure presented in Equation 1:
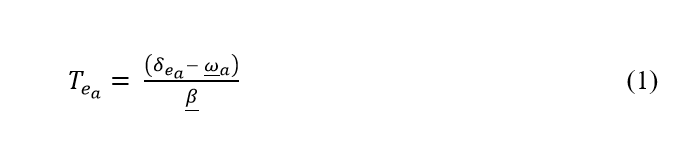
Where ![]() represents the annualized return generated by the fund or portfolio, while
represents the annualized return generated by the fund or portfolio, while ![]() represents the annual risk-free rate of return, and the
represents the annual risk-free rate of return, and the ![]() represents the portfolio’s beta coefficient (Ali et al., 2023). The results of the Treynor Index indicate that the higher the value of the indicator, the better the portfolio’s performance (Qur'anitasari et al., 2019). In accordance with the above, it can be defined that:
represents the portfolio’s beta coefficient (Ali et al., 2023). The results of the Treynor Index indicate that the higher the value of the indicator, the better the portfolio’s performance (Qur'anitasari et al., 2019). In accordance with the above, it can be defined that:
- If the Treynor Index yields a negative result, it means that the financial asset under analysis delivers a return lower than the risk-free rate.
- If the Treynor Index yields a result below 1, it means that the return obtained by the financial asset does not compensate for the risk assumed.
- If the Treynor Index is greater than 1, it indicates that the return obtained by the financial asset is adequately adjusted for the risk.
Since the application of the Treynor Index is conducted on SMEs in the Colombian logistics sector, the structuring of financial variables is based on the financial information of the companies under study and the characteristics of the operational sector.
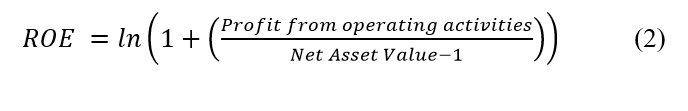
In the case of profitability, the use of return on equity (ROE) was proposed. ROE is calculated as the ratio between operating income and the equity value from the previous period, based on the perspective of excluding the effects of financing or indebtedness (if any) from the ROE measurement (Reyes et al., 2023).
Since financial information is subject to environmental changes and diverse operating conditions—resulting in nonlinear behavior—a logarithmic transformation of the indicator is proposed as a technique to normalize the data series of the companies under study (Roque et al., 2024). The structure for calculating profitability is presented below in Equation 2.
According to Popović and Paunović (2018), the risk-free rate represents the required return of an asset with a guaranteed future cash flow, a characteristic that theoretically qualifies it as a risk-free asset (Botello, 2021). For the present study, the calculation structure proposed by Roque et al. (2023) is adopted, as described in Equation 3.
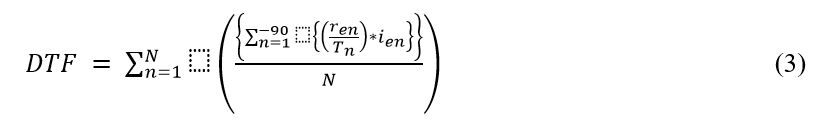
Where ![]() represents the revenue collected by entity e on day n, while
represents the revenue collected by entity e on day n, while ![]() refers to the total revenue collected by financial institutions (banks, corporations, and commercial finance companies). In this context,
refers to the total revenue collected by financial institutions (banks, corporations, and commercial finance companies). In this context, ![]() denotes the interest rate for 90-day Certificates of Deposit (CDTs) offered by the entity on day n.
denotes the interest rate for 90-day Certificates of Deposit (CDTs) offered by the entity on day n.
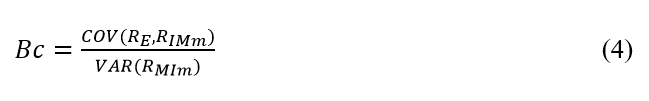
The final variable is the beta coefficient, which represents a measure of risk stemming from an investment’s exposure to general market movements. It expresses the sensitivity of an investment’s return relative to that of the overall market (Angelopoulos et al., 2016). For the purpose of this study, the accounting beta coefficient ![]() is used. This indicator helps determine the relationship between uncontrolled variables and the systematic risk of privately held companies (Roque & Carrero, 2021b). The
is used. This indicator helps determine the relationship between uncontrolled variables and the systematic risk of privately held companies (Roque & Carrero, 2021b). The ![]() is calculated as the covariance between the company’s accounting return and the sector’s accounting return, divided by the sector’s variance (Roque et al., 2021). The structure for calculating the accounting beta coefficient is presented below in Equation 4.
is calculated as the covariance between the company’s accounting return and the sector’s accounting return, divided by the sector’s variance (Roque et al., 2021). The structure for calculating the accounting beta coefficient is presented below in Equation 4.
Although the proposed calculation structure for the accounting beta coefficient is the most widely used and disseminated method for measuring systematic risk, authors such as Konieva and Stavárek (2023) recommend the use of the leveraged accounting beta, which incorporates the effects of indebtedness on the accounting beta by applying the leverage factor proposed by Damodaran (2012). The structure for calculating the leveraged accounting beta coefficient is presented below in Equation 5.

![]() represents the unleveraged accounting beta, while t denotes the organization’s effective tax rate during the fiscal period analyzed. In this context, κ represents the total value of liabilities, and λ refers to the company’s equity value.
represents the unleveraged accounting beta, while t denotes the organization’s effective tax rate during the fiscal period analyzed. In this context, κ represents the total value of liabilities, and λ refers to the company’s equity value.
Once the results of the Treynor Index were identified, a series of statistical tests were conducted to validate the study’s findings. In line with this, correlation tests were performed as a natural measure of the relationship between two random variables (Wooldridge, 2009). The association between the defined variables was assessed using the correlation matrix presented in Equation 6:
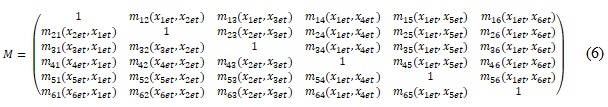
Where:

To measure the relationship between the Treynor Index and the financial variables analyzed, the relational scale proposed by Martínez et al. (2009) was used:
- If the range is between 0 and 0.25, the relationship is negligible.
- If the range is between 0.26 and 0.50, the relationship is weak.
- If the range is between 0.51 and 0.75, the relationship is moderate.
- If the range is between 0.76 and 1, the relationship is strong
In order to determine whether, on average, the profitability of the companies in each year analyzed is greater than their systematic risk, the following hypothesis test was formulated for each year:
- H0= On average, the profitability of SMEs in the freight forwarding sector did not compensate their owners for the risk taken during the year.
- H1= On average, the profitability of SMEs in the freight forwarding sector compensated their owners for the risk taken during the year.
The formula for calculating the test statistic is presented in Equation 7.
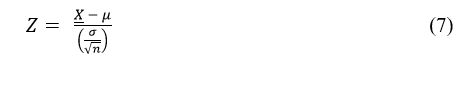
Where:
Z represents the test statistic; Xˉ\bar{X}Xˉ is the Treynor coefficient of the companies; where μ\muμ denotes the threshold for systematic risk compensation; σ\sigmaσ represents the standard deviation of the Treynor coefficient; and n is the number of companies. The rejection criterion is: Z > 1.64, with a 5% alpha level.
As a complement to the previous hypothesis test, a second test was formulated to determine whether the situation reflects a structural condition within the companies. For this purpose, the following hypotheses were defined:
- H₀: The average profitability of SME “e” during the observation window did not compensate its owners for the risk assumed.
- H₁: The average profitability of SME “e” during the observation window did compensate its owners for the risk assumed.
Given that the observation window spans five years (2019 to 2023), Equation 8 is proposed for use:
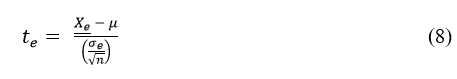
Where ![]() represents the t-statistic for SME e, where
represents the t-statistic for SME e, where ![]() is the average Treynor coefficient score, while
is the average Treynor coefficient score, while ![]() denotes the standard deviation of the Treynor coefficient. n is the number of years analyzed. The rejection criterion is
denotes the standard deviation of the Treynor coefficient. n is the number of years analyzed. The rejection criterion is ![]() > 2,1318, with a 5% alpha level and n − 1 degrees of freedom.
> 2,1318, with a 5% alpha level and n − 1 degrees of freedom.
To carry out this research, an econometric methodology based on panel data was employed, which allows for the integration of both the temporal and structural dimensions of different units of analysis (Mayorga & Muñoz, 2000). In the analytical process, the correlation among the variables under study is examined, and both the Fixed Effects Model (FEM) and the Random Effects Model (REM) are estimated. Subsequently, the Hausman test is applied to determine which of the two approaches is more appropriate for the model specification. The structure of the FEM is presented below in Equation 9.

Next, the structure for calculating the Random Effects Model (REM) is presented in Equation 10.
![]()
Equation 11 presents the Hausman Test

Where:
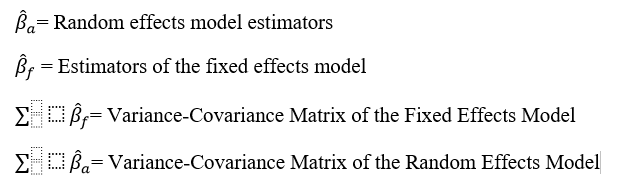
For the validation of the Hausman test, the following hypothesis tests were formulated
 = The random effects model (P-Value>0.05) adequately reflects the behavior of the data. Therefore, the unobservable effect is not correlated with the explanatory variables.
Results
This section begins with the analysis of the Treynor Index, examining the correlation between financial variables and the index, followed by the evaluation of the proposed hypotheses. Next, the results of the fixed and random effects models are presented. Finally, the findings derived from the Hausman test are discussed. Table 1 details the behavior of the Treynor Index during the 2019–2023 period.
Table 1
Behavior of the Treynor Index during the 2019–2023 period
Métrica |
2019 |
2020 |
2021 |
2022 |
2023 |
Percentile 25 |
0,14 |
-0,47 |
0,49 |
0,47 |
-0,41 |
Median |
0,43 |
0,48 |
1,39 |
1,19 |
0,24 |
Percentile 75 |
0,76 |
1,02 |
2,27 |
1,79 |
0,39 |
Interquartile Range |
0,62 |
1,48 |
1,78 |
1,32 |
0,80 |
Source: Authors’ own elaboration.
In 2019, the lower quartile showed a value of 0.14, and neither the median nor the 75th percentile reached the threshold for risk compensation, with values of 0.43 and 0.76, respectively. This indicates that performance was insufficient to compensate for systematic risk in the majority of companies. However, in 2020, while the 25th percentile dropped to -0.47—indicating that for this group of companies, profitability did not even compensate the risk-free rate—the 75th percentile improved, reaching a value of 1.02, which suggests that some organizations were able to generate returns commensurate with the risk assumed.
The trend improved in 2021, as the 25th percentile rose from a negative figure to 0.49, and the median surpassed the compensation threshold with a value of 1.39, while the 75th percentile reached 2.27. This indicates that, for that year, companies within this group comfortably compensated for systematic risk. This improvement continued in 2022; however, in 2023, a deterioration was observed: the 25th percentile fell to -0.41, and both the median and the 75th percentile were below the risk compensation threshold, with values of 0.24 and 0.39, respectively. These figures reflect a challenging year in terms of profitability and variability in performance.
Table 2 illustrates the behavior of the variables and the Treynor coefficient during the 2019–2023 period.
Table 2
Correlation Between Variables and the Treynor Index in the 2019–2023 Period
Variable |
2019 |
2020 |
2021 |
2022 |
2023 |
|||||
r |
Relation |
r |
Relation |
R |
Relation |
r |
Relation |
r |
Relation |
|
X1 |
0,03 |
Negligible |
0,04 |
Negligible |
0,05 |
Negligible |
0,03 |
Negligible |
0,05 |
Negligible |
X2 |
0,04 |
Negligible |
0,02 |
Negligible |
0,04 |
Negligible |
0,03 |
Negligible |
0,08 |
Negligible |
X3 |
0,01 |
Negligible |
0,04 |
Negligible |
0,05 |
Negligible |
0,01 |
Negligible |
0,03 |
Negligible |
X4 |
0,06 |
Negligible |
0,06 |
Negligible |
0,07 |
Negligible |
0,00 |
Negligible |
-0,32 |
Weak |
X5 |
0,07 |
Negligible |
0,09 |
Negligible |
0,05 |
Negligible |
0,03 |
Negligible |
0,08 |
Negligible |
X6 |
0,06 |
Negligible |
-0,41 |
Weak |
-0,16 |
Negligible |
-0,81 |
Strong |
0,06 |
Negligible |
Source: Authors’ own elaboration.
Sales-to-equity, direct costs-to-equity, and administrative expenses-to-equity exhibit negligible correlations (r ranging from 0.01 to 0.08), indicating that these are not predominant characteristics in risk compensation. This suggests that other unexamined factors may play significant roles in performance. Selling expenses-to-equity showed a shift in 2023, with a negative correlation (r = -0.32), pointing to a potential variation in the efficiency of these activities.
Conversely, the liabilities-to-equity variable demonstrated the highest variability in its correlations, ranging from negligible to strong negative associations (r up to -0.81), as seen in 2020 and 2022. This reflects that, in certain years, leverage has been a significant feature among underperforming companies. This finding aligns with financial theory, which links higher levels of debt with increased risk and higher capital costs. Table 3 presents the results of the hypothesis testing year by year.
Table 3
Results of the Hypothesis Test by Year
Metric |
2019 |
2020 |
2021 |
2022 |
2023 |
Mean |
-2.562,66 |
-14,41 |
-13,35 |
0,00 |
-3,85 |
Theoretical Mean |
1 |
1 |
1 |
1 |
1 |
Standard Deviation |
19.482,01 |
77,32 |
76,44 |
5,18 |
22,59 |
Observations |
59 |
59 |
59 |
59 |
59 |
Test Statistic |
-1,01 |
-1,53 |
-1,44 |
-1,48 |
-1,65 |
Rejection Value |
1,64 |
1,64 |
1,64 |
1,64 |
1,64 |
Decision |
Do not reject H₀ |
||||
Source: Authors’ own elaboration
The annual hypothesis tests indicate that the profitability of SMEs did not compensate for systematic risk during the observation window analyzed in the study. In 2019, the average Treynor Index was -2,562.66 with a standard deviation of 19,482.01, reflecting the presence of outliers in the measurement. The test statistic was -1.01, which did not reach the critical value of 1.64, leading to a failure to reject the null hypothesis. This trend continued in 2020 and 2021, with negative averages of -14.41 and -13.35, respectively, and test statistics that also fell below the threshold, confirming that, in general terms, the levels of profitability achieved by the organizations were not sufficient to offset the assumed systematic risk.
In 2022, the index showed a neutral behavior with an average of 0.00 and a test statistic of -1.48, which remained insufficient to reject the null hypothesis. In 2023, although the average improved to -3.85, the result remained negative, and the test statistic of -1.65 was still far from the critical value, again resulting in the null hypothesis not being rejected. These findings reflect a persistent lack of risk compensation, suggesting that other factors may be influencing organizational performance.
As a complement to the previous test, the second hypothesis test, applied individually to each of the companies, reveals a widespread lack of risk compensation, evidenced by 100% of the cases in which the null hypothesis was not rejected. This consistency suggests the presence of structural conditions within the sector that affect organizations across the board, regardless of their size or the financial strategies adopted. Among the factors identified are high industry volatility, deficiencies in risk management, and inefficient cost structures, all of which limit risk-adjusted profitability. This indicates that current business models are not generating sufficient returns in relation to the risk undertaken.
Regarding the implementation of the panel data methodology, the results corresponding to the fixed effects model are presented in Table 4.
Table 4
Results of the Fixed Effects Model of the Treynor Index
Fixed-effects (within) regression |
|
Number of obs |
= |
295 |
||
Group variable: Empresa |
|
Number of groups |
= |
59 |
||
R-sq: |
|
|
|
Obs per group: |
|
|
within = 0,0009 |
|
|
Min |
= |
5 |
|
between = 0,0005 |
|
|
Avg |
= |
5 |
|
overall = 0,0000 |
|
|
max |
= |
5 |
|
|
|
|
|
F(6,230) |
= |
0,03 |
corr(u_i, Xb) = -0,2294 |
|
Prob > F |
= |
0,9998 |
||
Treynor |
Coef. |
Std. Err. |
t |
P>|t| |
[95% Conf. Interval] |
|
X1 |
-50,2416 |
165,2771 |
0,3000 |
0,7610 |
-375,8924 |
275,4091 |
X2 |
48,6875 |
166,1853 |
0,2900 |
0,7700 |
-278,7526 |
376,1276 |
X3 |
115,9684 |
299,6917 |
0,3900 |
0,6990 |
-474,5236 |
706,4603 |
X4 |
-43,2567 |
634,9074 |
0,0700 |
0,9460 |
-1.294,2350 |
1.207,7210 |
X5 |
-2,2047 |
217,2391 |
0,0100 |
0,9920 |
-430,2378 |
425,8285 |
X6 |
-62,5835 |
523,2354 |
0,1200 |
0,9050 |
-1.093,5310 |
968,3638 |
_cons |
-599,1814 |
893,6020 |
0,6700 |
0,5030 |
-2.359,8740 |
1.161,5110 |
sigma_u |
4043,4852 |
|
|
|
|
|
sigma_e |
8898,0176 |
|
|
|
|
|
Rho |
0,1712 |
(fraction of variance due to u_i) |
|
|
||
F test that all u_i=0: F(58. 230) = 0,97 |
|
Prob > F = 0,5370 |
||||
Source: Authors’ own elaboration.
The fixed effects model reveals a limited capacity to explain the variability of the Treynor Index, as demonstrated by the R-squared values across all contexts analyzed (within = 0.0009, between = 0.0005, overall = 0.0000). This indicates that the variables selected under this model provide little to no explanatory power regarding variations in risk compensation. Additionally, the F-test, with a value of F (6,230) = 0.03 and a probability greater than F of 0.9998, suggests that the model's coefficients, taken together, do not differ statistically from zero, reinforcing the model's inadequacy in clarifying systematic risk compensation.
As for the independent variables—such as sales-to-equity, direct costs-to-equity, among others—all were statistically insignificant, with small effect sizes and confidence intervals crossing zero, confirming they do not influence the Treynor Index. Most of the variability in financial indicators is attributed to idiosyncratic error terms, with the variance components Sigma_u (4,043.4852) and Sigma_e (8,898.0176) indicating that year- and firm-specific errors are predominant. The Rho value (0.1712) shows that only about 17% of the total variation is due to differences between companies. Based on this, it is concluded that most of the fluctuation stems from other factors not captured by the model. The results of the random effects model are shown in Table 5.
Table 5
Results of the Random Effects Model of the Treynor Index
Random-effects GLS regression |
|
Number of obs |
= |
295 |
||
Group variable: Empresa |
|
Number of groups |
= |
59 |
||
R-sq: |
|
|
|
Obs per group: |
|
|
within = 0,0000 |
|
|
min |
= |
5 |
|
between = 0,0134 |
|
|
avg |
= |
5 |
|
overall = 0,0012 |
|
|
max |
= |
5 |
|
|
|
|
|
Wald chi2(6) |
= |
0,31 |
corr(u_i, X) = 0 (assumed) |
|
Prob > chi2 |
= |
0,9994 |
||
Treynor |
Coef. |
Std. Err. |
z |
P>|z| |
[95% Conf. Interval] |
|
X1 |
2,8086 |
91,7081 |
0,0300 |
0,9760 |
-176,9360 |
182,5533 |
X2 |
-2,0733 |
94,3756 |
0,0200 |
0,9820 |
-187,0461 |
182,8995 |
X3 |
-5,1930 |
113,3943 |
0,0500 |
0,9630 |
-227,4418 |
217,0558 |
X4 |
9,0613 |
482,2864 |
0,1900 |
0,8510 |
-854,6507 |
103,5877 |
X5 |
5,7306 |
165,5310 |
0,3500 |
0,7290 |
-267,1284 |
381,7413 |
X6 |
9,1953 |
288,1017 |
0,3200 |
0,7500 |
-472,7157 |
656,6221 |
_cons |
-7,3821 |
685,4982 |
1,0800 |
0,2820 |
-2081,7590 |
605,3446 |
sigma_u |
1060,8856 |
|
|
|
|
|
sigma_e |
8898,0176 |
|
|
|
|
|
Rho |
0,0140 |
(fraction of variance due to u_i) |
|
|
||
Source: Authors’ own elaboration.
The random effects model reveals that it explains only a minimal fraction of the variability in the Treynor Index factors, as demonstrated by the R-squared values (within = 0.0000, between = 0.0134, overall = 0.0012). This indicates that the selected variables do not capture the factors influencing risk compensation in the sector. Moreover, the Wald Chi² value of 0.31 with a p-value greater than 0.9994 confirms that the independent variables, as a whole, lack statistical significance, suggesting that they have limited influence on systematic risk compensation.
Regarding the independent variables, all show high p-values above 0.05, confirming they are not statistically significant. The wide confidence intervals further confirm the uncertainty in the parameter estimates. The model estimates a sigma_u of 1,060.8856 and a sigma_e of 8,898.0176, indicating that within-firm variability is greater than between-firm variability due to random effects. The Rho value of 0.0140 indicates that only 1.4% of the total variation in the Treynor Index is attributable to differences between organizations, suggesting these are not a significant source of the observed fluctuations. The results of the Hausman Test are presented in Table 6.
Table 6
Hausman Test – Treynor Index
Variables |
(b) |
(B) |
(b-B) |
sqrt(diag(V_b-V_B)) |
fe1 |
re1 |
Difference |
S.E. |
|
X1 |
-50,2416 |
2,8086 |
-53,0502 |
137,4996 |
X2 |
48,6875 |
-2,0733 |
50,7608 |
136,7874 |
X3 |
115,9684 |
-5,1930 |
121,1613 |
277,4109 |
X4 |
-43,2567 |
90,6133 |
-133,8700 |
412,9251 |
X5 |
-2,2047 |
57,3065 |
-59,5112 |
140,6852 |
X6 |
-62,5835 |
91,9532 |
-154,5366 |
436,7753 |
b = consistent under Ho and Ha; obtained from xtreg |
||||
B = inconsistent under Ha, efficient under Ho; obtained from xtreg |
||||
Test: Ho: difference in coefficients not systematic |
||||
chi2(6) |
= (b-B)'[(V_b-V_B)^(-1)](b-B) |
|||
|
= 0,66 |
|
|
|
Prob>chi2 |
= 0,9953 |
|
|
|
Source: Authors’ own elaboration
The Hausman test reveals discrepancies between the independent variables in the fixed and random effects models for variables X1 to X6, with notable differences in X4 and X6, showing values of -133.8700 and -154.5366, respectively, accompanied by high standard errors. The chi² value was 0.66 with 6 degrees of freedom and a p-value of 0.9953, indicating that the null hypothesis cannot be rejected. This suggests that the differences between financial indicators are not systematic, thus supporting the random effects model as the most appropriate for this type of analysis. This result implies that inter-company variations are considered random and uncorrelated with the variables over time, validating the use of the random effects model in the specific context of SMEs in the sector.
Discussion
This study presents limitations related to the absence of relevant external variables, such as fuel costs and regulatory fluctuations, which may restrict its practical applicability. These limitations are consistent with those observed in previous studies, such as Manap et al. (2024), who emphasized the importance of incorporating contextual variables in the analysis of the Treynor Index.
Unlike previous studies that focus on developed stock markets (Lu et al., 2021) or sectors with more defined structures (Atmaca, 2022), this research addresses an emerging market characterized by privately held companies with unique traits such as high fragmentation and dependence on international supply chains. As such, the study provides a novel contribution by applying the Treynor Index in a sector sensitive to macroeconomic and operational factors, and in firms that are not publicly traded.
Based on the findings, a future research direction is to explore how specific contextual variables—such as digital technology adoption and sustainability—may influence the risk-adjusted profitability of logistics SMEs. This recommendation aligns with previous studies like Manap et al. (2024) and Jana et al. (2024), who advocate integrating dynamic factors in the evaluation of the Treynor Index. Additionally, the incorporation of both macro- and microeconomic contextual variables—such as fuel prices and/or exchange rate volatility—is proposed through econometric models or explanatory machine learning approaches. This would enhance the predictive capacity of the Treynor Index in high-uncertainty contexts.
Another future research avenue could focus on comparing the Treynor Index with other risk-adjusted performance measures (such as the Sortino Ratio, the Modigliani and Modigliani Index (M²), and Jensen's Alpha), which would allow for the identification of the metric with the greatest explanatory power in assessing financial performance in SMEs. Similarly, a further line of inquiry may involve designing a hybrid method tailored to the SME context, integrating systematic risk, total risk, and downside performance. Such a hybrid model would make it possible to adapt financial performance measurement to the risk profile of small and medium-sized enterprises in Colombia.
Conclusions
The behavior of the Treynor coefficient reveals differences in the ability of firms to balance risk. Although profitability, in general, did not offset systematic risk, the years 2020, 2021, and 2022 showed an exception at the 75th percentile. Similarly, challenges were observed in 2020, with a segment of firms reporting negative returns. In addition, the correlation analysis between variables and the Treynor coefficient suggests that, although most relationships are negligible, annual variations in some metrics warrant closer examination.
The consistency in the annual analyses, where the null hypothesis is sustained, indicates a clear pattern: on average, SMEs failed to compensate their equity investors for the risk assumed. The variability observed, especially in 2019, suggests the influence of outlier elements or a diversity within the sector that may be impacting risk-adjusted profitability. Given these results, which reflect an insufficient compensation of risk, it is advisable for these companies to reconsider and adjust their financial management approaches.
The fixed effects model reveals that the selected financial variables fail to explain variations in the Treynor coefficient. This insufficiency is also evident in the random effects model. In accordance with the results of the Hausman test, the use of the random effects model is recommended, although this choice should be complemented with an assessment of the relevance of the selected factors.
The findings reveal that the Treynor Index does not adequately capture risk compensation in Colombian logistics sector SMEs between 2019 and 2023. The hypothesis tests and the fixed and random effects models demonstrate a general insufficiency in risk-adjusted returns, implying that companies face difficulties in efficiently managing systematic risk. This outcome has implications for corporate policy and financial decision-making, highlighting the need to improve leverage strategies and cost optimization. Furthermore, the lack of risk compensation suggests that logistics SMEs should adopt more advanced financial tools and diversify their funding sources to mitigate macroeconomic vulnerabilities.
The relevance of this research lies in the need for financial tools that enable a precise assessment of the relationship between profitability and risk in volatile economic contexts such as Colombia. Specifically, the use of the Treynor Index allows for a deeper analysis of systematic risk-adjusted financial performance in small and medium-sized enterprises—a business segment that, while strategic to the economy, is often exposed to adverse structural conditions and has limited risk hedging mechanisms.
This study provides empirical evidence on the applicability of the Treynor Index in the logistics sector, particularly in privately held firms, and offers a replicable methodological foundation for other sectors and regions with similar characteristics. Moreover, it opens the door to future research that explores the integration of other financial factors that explain performance while compensating for systematic risk, adapting methodologies traditionally associated with market finance to the realm of corporate finance.
Ethical considerations
The present research did not require ethical endorsement because freely available data published in the Integrated Corporate Information System of the Superintendence of Corporations of Colombia were used.
Conflict of interest
All authors made significant contributions to the document and declare that there is no conflict of interest related to this article.
Authors' contribution statement
Daniel Isaac Roque: Conceptualization, Methodology, Formal Analysis, Writing - Original Draft Draft: revision and editing.
Andrés Caicedo Carrero: Conceptualization, Methodology, Formal analysis, Writing - Original draft.
Oscar Humberto Quintero Landinez: Conceptualization, Methodology, Formal analysis, Writing - Original draft.
Source of financing
The present research did not require the use of financing sources.
References