https://doi.org/10.22267/rtend.252602.278
Research Article
Finance
Stock market interrelationships in the Latin American Integrated Market (MILA): a VAR approach to short-term dynamics (2015–2022)
Interrelaciones bursátiles del Mercado Integrado Latinoamericano (MILA): un enfoque VAR para la dinámica de corto plazo (2015-2022)
Por:1Luis Enrique Cayatopa-Rivera![]() ; 2Héctor Javier Bendezú-Jiménez
; 2Héctor Javier Bendezú-Jiménez![]()
1 Master's Degree in Public Administration, Universidad Católica Sedes Sapientiae. Professor attached to the Graduate School of the Economic and Commercial Sciences Unit, Universidad Católica Sedes Sapientiae. ORCID: 0000-0002-6359-2125. E-mail: lcayatopa@ucss.edu.pe, Lima - Peru.
2 PhD in International Economics and Development, Complutense University of Madrid. Senior Professor, Faculty of Economic Sciences, Universidad Nacional Mayor de San Marcos. ORCID: 0000-0001-9530-6472. Email: hbendezuj@unmsm.edu.pe, Lima - Peru.
Received:May 10, 2025
Accepted: June 24, 2025
DOI: https://doi.org/10.22267/rtend.252602.278
How to cite this article: Cayatopa-Rivera, L., & Bendezú-Jiménez, H. (2025). Stock market interrelationships in the Latin American Integrated Market (MILA): a VAR approach to short-term dynamics (2015–2022). Tendencias, 26(2), 136-161. https://doi.org/10.22267/rtend.252602.278
![]()
Abstract
Introduction: This study is part of the analysis of the Latin American Integrated Market (MILA) made up of the Peruvian, Chilean and Colombian stock exchanges since 2011, and expanded in 2014 with the incorporation of Mexico. Objective: The main objective is to analyze the behavior of the stock market indices of the MILA member countries and the dynamics of their interrelationship. Methodology: Indices were normalized, stationarity was evaluated using the Augmented Dickey-Fuller test (ADF), the Johansen cointegration test was applied, and a VAR in differences was estimated to analyze the interactions between stock indices. The period of analysis covers from 2015 to 2022. Results: The series were non-stationary at level and integrated in order one. No evidence of cointegration was found between MILA indices, nor in subsets. The VAR model showed significant short-term relationships, especially between the Mexican Index of Prices and Quotations (IPC), the General Index of the Lima Stock Exchange (IGBVL), the Selective Stock Price Index (IPSA) and the Colombian Capitalization Index (COLCAP). Impulse-response analyses confirmed transient interdependencies. Conclusions: There is no long-term stock market integration between the MILA markets. However, significant short-term interactions are detected. This suggests the transmission of shocks and common reactions to external events, with implications for regional diversification and more effective financial integration policies.
Keywords: VAR model; cointegration; financial integration; emerging markets; financial markets; MILA.
JEL: G10; G11; G12; G14; G15; G17.
Resumen
Introducción: Este estudio forma parte del análisis del Mercado Integrado Latinoamericano (MILA) conformado por las bolsas de valores de Perú, Chile y Colombia desde el año 2011, y se amplió en el año 2014 con la incorporación de México. Objetivo: El objetivo principal es analizar el comportamiento de los índices bursátiles de los países miembros del MILA y la dinámica de su interrelación. Metodología: Se normalizaron los índices, se evaluó la estacionariedad mediante la prueba de Dickey-Fuller aumentada (ADF), se aplicó la prueba de cointegración de Johansen y se estimó un VAR en diferencias para analizar las interacciones entre los índices bursátiles. El periodo de análisis abarca desde 2015 hasta 2022. Resultados: Las series fueron no estacionarias a nivel e integradas en el orden uno. No se encontró evidencia de cointegración entre los índices MILA, ni en subconjuntos. El modelo VAR mostró relaciones significativas de corto plazo, especialmente entre el Índice Mexicano de Precios y Cotizaciones (IPC), el Índice General de la Bolsa de Valores de Lima (IGBVL), el Índice Selectivo de Precios de Acciones (IPSA) y el Índice de Capitalización Colombiano (COLCAP). Los análisis de impulso-respuesta confirmaron las interdependencias transitorias. Conclusiones: No existe una integración bursátil a largo plazo entre los mercados del MILA. Sin embargo, se detectan interacciones significativas a corto plazo. Esto sugiere la transmisión de shocks y reacciones comunes a eventos externos, con implicaciones para la diversificación regional y políticas de integración financiera más efectivas.
Palabras clave: Modelo VAR; cointegración; integración financiera; mercados emergentes; mercados financieros; MILA.
JEL: G10; G11; G12; G14; G15; G17.
Resumo
Introdução: Este estudo faz parte da análise do Mercado Integrado Latino-Americano (MILA) composto pelas bolsas de valores peruana, chilena e colombiana desde 2011, e ampliado em 2014 com a incorporação do México. Objetivo: O objetivo principal é analisar o comportamento dos índices bolsistas dos países membros do MILA e a dinâmica da sua inter-relação. Metodologia: Os índices foram normalizados, a estacionariedade foi avaliada por meio do teste de Dickey-Fuller Aumentado (ADF), o teste de cointegração de Johansen foi aplicado e um VAR em diferenças foi estimado para analisar as interações entre os índices de ações. O período de análise abrange de 2015 a 2022. Resultados: As séries foram não estacionárias no nível e integradas na ordem um. Não foram encontradas evidências de cointegração entre os índices MILA, nem em subconjuntos. O modelo VAR mostrou relações significativas de curto prazo, especialmente entre o Índice Mexicano de Preços e Cotações (IPC), o Índice Geral da Bolsa de Valores de Lima (IGBVL), o Índice Seletivo de Preços de Ações (IPSA) e o Índice de Capitalização Colombiana (COLCAP). As análises de resposta ao impulso confirmaram interdependências transitórias. Conclusões: Não há integração do mercado de ações de longo prazo entre os mercados MILA. No entanto, são detectadas interações significativas de curto prazo. Isso sugere a transmissão de choques e reações comuns a eventos externos, com implicações para a diversificação regional e políticas de integração financeira mais eficazes.
Palavras-chave: Modelo VAR; cointegração; integração financeira; mercados emergentes; mercados financeiros; MILA.
JEL: G10; G11; G12; G14; G15; G17.
Introduction
Regional integration is a process that includes coordination, cooperation, convergence, and deep integration, whose scope encompasses not only economic and trade issues, but also political, social, cultural, environmental, and financial issues (Economic Commission for Latin America and the Caribbean, 2014). In this framework, initiatives such as the European Union, the Association of Southeast Asian Nations (ASEAN), the Union of South American Nations (UNASUR) and others (Camara-Neto & Vernengo, 2010; Espinoza et al., 2011; Kim & Lee, 2012; Ocampo & Titelman, 2010; Pérez, 2010; Volz, 2013), articulated with a complex financial architecture, allow the integration and free mobility of capital, thus favoring the circulation of currency and the convergence of interest rates.
In parallel with the progress of integration, the literature has debated the information efficiency of financial markets. Fama (1995) studies the random walk hypothesis and confirms that, in developed markets, prices incorporate available information so quickly that returns are essentially unpredictable, which is the starting point for testing information efficiency in emerging economies. However, Hyme (2003) offers a critique of the theory of perfectly efficient markets, pointing out that information asymmetries and transaction costs generate persistent inefficiencies, especially in environments with less regulatory transparency, such as Latin American markets. Precisely, these debates on efficiency and the need to reduce frictions gave rise to institutional reforms that, in several economic blocs, materialized through increasingly profound financial integration processes.
Since 1957, with the establishment of the European Union through the Treaty of Rome, the creation of a common market began where goods, services, people, and capital could flow freely (Duwicquet and Mazier, 2011). The combination of cross-border integration of financial markets and the liberalization of previously repressed national financial systems, following the collapse of the Bretton Woods system in 1971, has been one of its fundamental transformations.
Thus, after the opening of capital accounts and the introduction of unique banking licenses in the 1980s, integration was officially completed at the end of 1992. The introduction of the euro in 1999 gave a new impetus to financial integration by eliminating currency-related costs and risks in international financial operations (Duwicquet and Mazier, 2011; Espinoza et al., 2011; Gur, 2013).
From the above, the global trend of transformation and integration of securities markets is evident, in its mission to become more competitive. In this sense, the most important integration of stock markets was Euronext, in 2000 (Schmiedel & Schönenberger, 2005; Volz, 2013). In 2004, the Copenhagen, Stockholm and Helsinki stock exchanges merged into OMX Nordic. Subsequently, in 2007, Euronext merged with the New York Stock Exchange (NYSE), which resulted in the creation of NYSE-Euronext. In 2008, OMX Nordic was bought by NASDAQ, and the London Stock Exchange (LSE) acquired the Italian Stock Exchange (Borsa Italiana).
Following this trend, negotiations were conducted in subsequent years for additional mergers, namely those of the LSE and the Toronto Stock Exchange, the NYSE-Euronext and Deutsche Börse, and the Singapore Stock Exchange and the Australian Securities Exchange (ASX), given the benefits to be gained from economies of scale, where there is greater scope and positive externalities created by integration, which allows costs to be reduced and efficiency to be increased in the negotiation of financial assets (Schmiedel & Schönenberger, 2005).
Thus, in May 2011, within the framework of the Pacific Alliance, the initial stage of integration between the Santiago Stock Exchange (SSE), the Colombian Stock Exchange (BVC) and the Lima Stock Exchange (BVL), currently known as the Latin American Integrated Market (MILA), began.
The MILA is the result of an agreement signed by the SSE, the BVC and the BVL, in addition to the Central Securities Depositories (CSDs) Central Securities Depository of Colombia (Deceval) and Cavali. Since 2008, these institutions began the process of creating a regional market for the trading of equity securities from these three countries, during which the routing of orders between the three stock exchanges was enabled, which motivated stockbrokers to implement correspondence agreements with brokers from other exchanges (Seraylán, 2014). Subsequently, in June 2010, an agreement was signed to implement the integration project, followed by the launch of the same by the three exchanges at the end of 2010. On May 30, 2011, MILA began its operations, aimed at creating an integrated market of equity securities that is attractive to local and foreign investors, as it is a broad market where they can diversify their investments. In December 2014, the Mexican Stock Exchange (BMV) officially celebrated the agreement, further increasing the size of the exchange available to investors through this integration project.
Despite progress in financial integration in Latin America, there is still a gap in the empirical understanding of the dynamic linkages between the stock markets of MILA member countries. In view of the above, and considering the objectives of the MILA to: (a) build an integration area that allows the free circulation of goods, services, capital and labor; (b) boost the growth and competitiveness of participating economies; and (c) to become a platform for political, economic and commercial articulation focused on the Asia-Pacific region, the purpose of this study is to analyze, through a VAR model, the behavior of the stock market indices of the MILA member countries from 2015 to the end of 2022.
Literature review
According to Carrieri et al. (2007), integration processes in capital markets are gradual and take several years, with occasional delays. In general, they are part of important efforts that must include proposals for reform of the financial sector and the economy within a political process. While these changes have sometimes begun with regulatory reforms, this does not necessarily imply that the market has been integrated.
Along these lines, the evolution of market integration is also affected by the competition of foreign investors to enter a diversified market, as well as by the ability of domestic investors to invest abroad through direct investments (Carrieri et al., 2007; Markowitz, 1952). In this logic, the literature on the integration of financial markets and the convergence of stock market indices in emerging economies has focused mainly on countries in Asia and the Middle East (Endri et al., 2024; Espinoza et al., 2011; Frey & Volz, 2013; Lee et al., 2013; Traczyk, 2012; You et al., 2014).
In the case of the Middle East, Espinoza et al. (2011) analyzed the degree of regional financial integration of the countries that make up the Gulf Cooperation Council (GCC). Using data on interest rates, they showed that there is convergence and that the differences between interest rates are relatively short-lived, particularly in comparison with those in the euro area after 1999.
In the Asian context, You et al. (2014) explored whether economic integration could amplify financial contagion. To this end, they built a composite index of economic integration through a review of the gradual reforms and the processes of opening up Chinese financial markets. Using a dynamic conditional correlation model, they captured correlations between the returns of Chinese stocks and those of other major markets around the world, and found favorable evidence of both the existence of financial contagion and the influence of economic integration on its spread.
In line with Asian evidence, Endri et al. (2024) analyzed the integration of Indonesia's stock market with eight of its main trading partners, applying VAR models and Johansen cointegration. Their study revealed low long-term integration and dynamic short-term correlation, methodologically highlighting the applicability of these approaches to measure stock market interrelationships in emerging markets.
For their part, Kim and Lee (2012) applied a structural panel model of autoregressive vectors (VAR) to analyze the macroeconomic consequences of real and financial integration on production and consumption in East Asian economies. They concluded that, after the Asian crisis, the degree of real integration increased significantly both regionally and globally. In that same period, the measurements of quantities and prices reflected a greater degree of financial integration, unlike what was observed in the consumption relationship. In addition, regional financial integration was lower than global financial integration, according to this relationship, and lagged behind real integration, especially at the regional level.
In the case of Africa, Frey and Volz (2013) examined the effects of policy agreements on regional financial integration and their impact on the development of financial markets in sub-Saharan Africa, as well as on access to and cost of financing. They found that integration positively affects financial development when combined with a sufficient level of institutional quality; however, if institutional quality is below a certain threshold, integration generates negative effects on this development. However, integration shows no significant impact on either the ratio of private credit to Gross Domestic Product (GDP) or the efficiency of the banking sector.
In the case of Latin America, Agudelo et al. (2012) calculated the transaction costs associated with the liquidity of stocks belonging to the markets of Argentina, Brazil, Chile, Colombia, Mexico and Peru, during the period from July 2009 to January 2010. The findings showed that countries with higher market capitalization, such as Brazil, Mexico and Chile, had lower transaction costs associated with liquidity compared to Peru, Argentina and Colombia. In addition, through a panel data model, a negative relationship between these costs and stock market activity was evidenced, as well as with the volatility of stock returns.
Subsequently, Lizarzaburu et al. (2015) determined the impact of MILA based on the main stock market indicators of Chile, Colombia, and Peru. Multiple variables were reviewed to measure their effect on returns, risk, correlations, and trading volumes across markets. To do this, they used indicators such as annual return, standard deviation, correlation coefficient and traded volumes, using a sample that spans from November 2008 to August 2013. The authors concluded that, at the beginning of the integration process, the results were not as expected, since the impacts on profitability, risk and correlation were marginal, while the impact on volumes was negative.
More recently, Cardona (2024) conducted a systematic review of MILA. After analyzing 85 publications (2008–2022), it mapped the main research topics developed after stock market integration. The study showed that, despite progress, the literature remains fragmented: there is little sectoral disaggregation, little attention to foreign exchange risk and transaction costs, limited work on contagion with other markets, and an underexploration of market risk (VaR) and ESG (Environmental, Social, and Governance) disclosure. Cardona proposes future lines of research, including measuring the operational impact of the Nuam Exchange (merger of the Chilean, Colombian, and Peruvian stock exchanges), evaluating the possible incorporation of Ecuador and Costa Rica, and delving into the transactional efficiency of MILA.
In addition, Hardy et al. (2018) evaluated the consequences of the implementation of the MILA, concluding that, although the agreement represented an institutional advance, its effects in terms of market efficiency were limited, highlighting a low impact on liquidity and the depth of integrated markets.
In line with these findings, Santillán-Salgado et al. (2017) explored the existence of nonlinear causality among MILA markets, using non-parametric causality models. Their results indicated asymmetric dependencies and nonlinear relationships between member countries' stock indices, suggesting that interactions cannot be fully captured by traditional linear models.
Similarly, Grobys (2010) found that, even among co-integrated European exchanges, the intensity of volatility spillovers has risen over time, suggesting that the nonlinear linkages identified for MILA could intensify as integration progresses.
On the other hand, more recent studies have focused on the dynamics of integration and the transmission of volatility. Fuentes and Pinilla (2021) analyzed the transmission of volatility between MILA markets, finding evidence of a moderate degree of integration, with more intense relations between Chile and Colombia, while the Peruvian market showed a lower connection in terms of shock transmission. In this sense, Cheung (2000) demonstrated that volatility shocks can be amplified and propagate rapidly during critical episodes, such as the 1987 crash, underlining the need to model high and low turbulence regimes when evaluating stock market integration.
In addition, Muñoz et al. (2022) evaluated dynamic correlations and market activity, concluding that, while MILA promoted greater initial interaction, correlations decreased over time, which could suggest that diversification opportunities still exist.
For their part, Vieito et al. (2024) examined herd behavior in MILA's integrated markets, using econometric analyses to identify collective decision patterns among investors. The findings indicated that herd behavior tends to intensify in contexts of high volatility, affecting the efficiency of markets and amplifying systemic risks, which constitutes an additional challenge for the effective integration of these markets.
In addition, Serrano and Núñez (2021) compared the predictive performance of the CaViaR and GARCH models to estimate the value at risk in the MILA and ASEAN-5 markets, demonstrating that the CaViaR model presented a better predictive capacity in contexts of high volatility, which implies a more robust tool for risk management in integrated markets.
Finally, Sosa et al. (2018) examined the dynamic links between the stock market and the exchange rate in MILA countries, applying Markov Regime Switching models. Their findings showed that the stock market returns of the MILA countries have high and low volatility regimes, and that the stock market exerts a greater influence on the exchange rate than vice versa, also highlighting a contagion relationship between the markets of Chile and Peru.
In summary, the literature reviewed shows relevant advances in the analysis of financial integration, although gaps persist regarding its recent dynamics and the specific interaction between the markets of Chile, Colombia, Mexico and Peru. This study is proposed as a contribution by offering an updated and comparative perspective, employing a robust methodological approach, which will allow a better understanding of the interrelationships and effects of stock market integration in the region.
Methodology
This research used daily data from the main stock market indices of the countries of Chile, Colombia, Mexico and Peru, for the period between 2015 and 2022. For the Peruvian case, the General Index of the Lima Stock Exchange (IGBVL) was used, while for Colombia, Chile and Mexico, the COLCAP (Colombian Capitalization Index), IPSA (Selective Stock Price Index) and IPC (Prices and Quotations Index) indices were considered, respectively. These indices will be referred to by their acronyms hereinafter. It should be noted that, for standardization purposes, all time series were normalized considering January 2, 2015 (=100) as a baseline, and the missing data were imputed using a linear interpolation methodology. The source of information was the specialized finance portal Investing (2024).
For the purposes of the research, a longitudinal quantitative approach was used, developing a cointegration analysis using autoregressive vectors (VAR) between the time series in question. The estimation of the model was made with the use of the Python programming language. The general methodological approach for time series analysis follows the guidelines proposed by Enders (2014), who details the procedures for unit root testing, cointegration, and estimation of VAR models.
For the cointegration analysis, the methodology proposed by Johansen (1988, 1991), widely used in multivariate time series studies, was used. As a previous step to its application, it is necessary to perform unit root tests (such as the Augmented Dickey-Fuller test (ADF), PP or KPSS) for each series, in order to verify that the variables are not stationary in levels, but stationary in first differences, i.e., I(1). Next, Johansen's test, which is based on eigenvalues, is applied to determine the cointegration range r (i.e., the number of long-run relationships between the variables). To do this, two main statistical contrasts are used (Equation 1):
Trace Test (r):
Where: T is the sample size; and λi are the eigenvalues ordered from highest to lowest.
H0: There are at most r cointegration vectors.
H1: There are more than r cointegration vectors.
Maximum Eigenvalue Test (Equation 2):

H0: there are r cointegration vectors.
H1: there are r+1 cointegration vectors.
After determining the value of the cointegration range r, the VECM model is estimated (Equation 3):

Where:
ΔYt is the first difference of Yt, which in turn represents the column vector (k×1) of endogenous variables
Γi measures the short-term relationship.
Π=αβ' is the long-term impact matrix.
The coefficients α indicate how much and how quickly the variables respond to imbalances with respect to the long term; that is, they measure the adjustment toward equilibrium.
The coefficients β represent stationary linear combinations of the variables; that is, they measure long-term equilibrium relationships.
On the other hand, Lütkepohl and Krätzig (2004) highlight that the VAR model, formulated by Sims (1980), is a robust tool to capture the joint dynamics of non-stationary financial series, an argument that supports the choice of these approaches in this study.
In this regard, mathematically, the VAR model is expressed in its general form in Equation 4.
Where:
Yt: represents a column vector (k×1) containing the k endogenous variables at time t.
C: represents a column vector of constants (k×1).
A1: represents a coefficient matrix (k×k) for all i=1,2,3,…,p, where p is the number of lags.
εt: represents an error vector, also called a dimension innovation vector (k×1), whose mean is expected to be zero, with a constant variance and no serial correlation.
Results
Stylized Facts
While it is true that the four indices start from the same baseline level of normalization (02/01/2015=100), they show different trajectories over time, reflecting the structural and macroeconomic differences between MILA economies. While some markets exhibit sustained recoveries, others present cycles of greater volatility and lag.
During the period analyzed, Peru's IGBVL shows the greatest dynamism and volatility (Figure 1), standing out as the index with the highest accumulated appreciation in several sections. In contrast, Colombia's COLCAP remains consistently below the rest, with weaker and more limited performance, failing to fully recover from severe declines.
Figure 1
Normalized MILA indices (Base 02/01/2015=100), 2015-2022
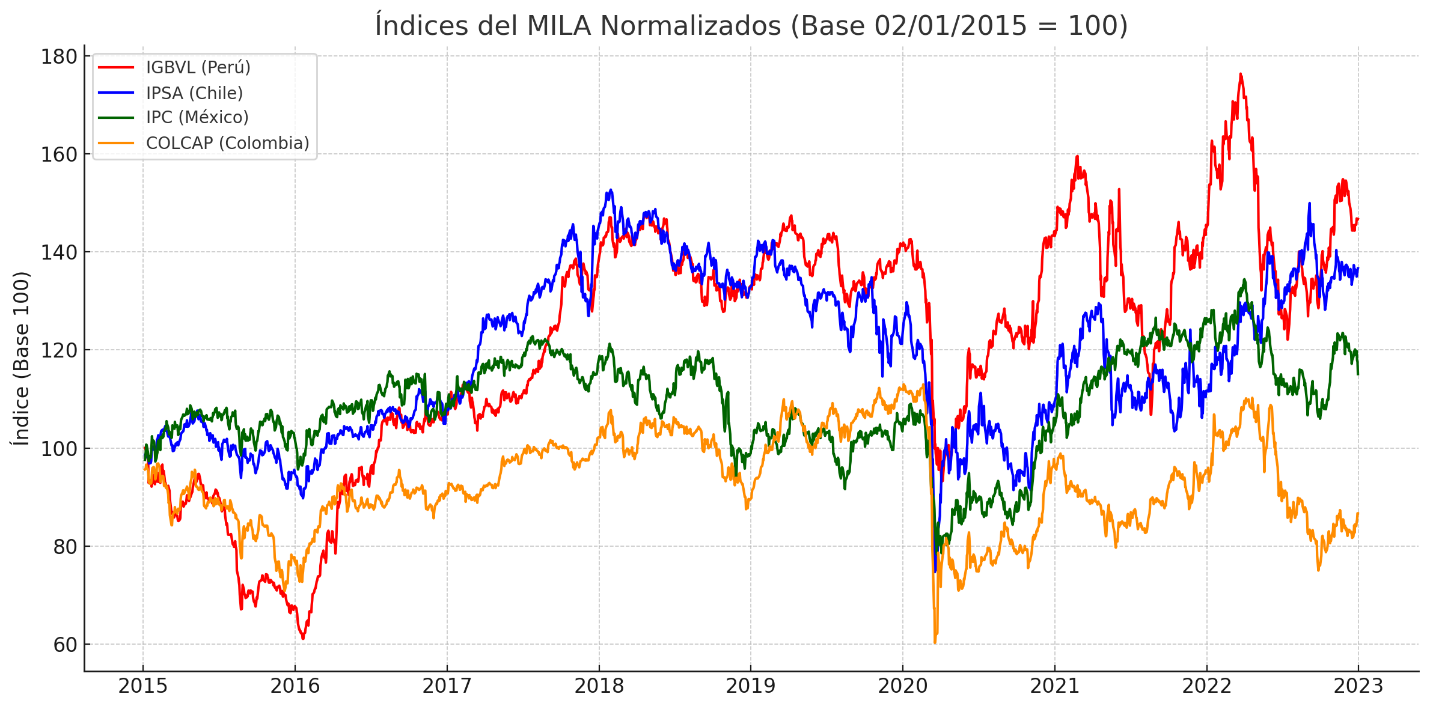
Source: Authors.
Conclusions
It is important to note that all indices showed an abrupt and synchronized drop in March 2020, associated with the crisis caused by the COVID-19 pandemic. This event reveals a high correlation between markets, at least in the face of global shocks. Subsequently, a general recovery is observed, although with different intensity and speed.
After the initial impact of the pandemic, the IGBVL showed a particularly strong recovery, surpassing its pre-pandemic levels in mid-2021. On the other hand, the COLCAP exhibited a weaker and more volatile recovery, with marked oscillations and inability to maintain sustained growth. The IPC and the IPSA had intermediate trajectories, with a relatively more stable IPC and an IPSA that recovered with a lag.
The Peruvian index (IGBVL) presented several phases of strong volatility, especially in 2021 and 2022, which could reflect political uncertainty or internal shocks. This behavior contrasts with Mexico's IPC, which, although it presents variations, maintains a more moderate and predictable trajectory in comparison.
Despite some joint movement in the face of extreme events, the relative levels between indices tend to diverge over the long term. For example, COLCAP is unable to close its gap with the other indices, which may be associated with structural factors in the Colombian market. In turn, the IGBVL shows moments of regional leadership, although with abrupt setbacks.
In short, a heterogeneous regional dynamic is revealed, in which indices share global shocks, but diverge in their long-term trajectories due to local factors. The high dynamism of the Peruvian market and the lagging evolution of the Colombian market stand out, in a context of partial interdependence between the MILA stock markets.
Stationarity analysis
The results show that three of the four series in levels do not reject the null hypothesis of unit root at 5%, which suggests that they are not stationary in levels.
Meanwhile, the ADF tests (Table 1) on the first differences reject the null hypothesis for all series (p-value < 0.05), indicating that the four series are integrated of order I(1), allowing us to continue with a cointegration analysis.
Table 1
Augmented Dickey-Fuller Unit Root Test (ADF)
Series |
Levels |
First differences |
||
ADF Statistician |
p value |
ADF Statistician |
p value |
|
COLCAP |
-3.0175 |
0.0333 |
-15.4462 |
0.0000 |
IGBVL |
-1.8647 |
0.3488 |
-10.6523 |
0.0000 |
IPC |
-2.3603 |
0.1533 |
-17.5769 |
0.0000 |
IPSA |
-2.0189 |
0.2783 |
-15.2329 |
0.0000 |
Source: Authors.
Cointegration Analysis
The results indicate that the null hypothesis of no cointegration (r≤0) is not rejected, nor are any of the subsequent hypotheses (r≤1, r ≤2), given that the trace statistics are less than the critical values at 5%. This suggests that there is insufficient statistical evidence of cointegration relationships between the four MILA indices (Table 2).
Table 2
Johansen Cointegration Test
Rank |
Statistical Trace |
Critical Value 5% |
Critical Value 1% |
Reject H0 (r ≤ ri) |
r ≤ 0 |
32.9272 |
47.8545 |
44.4929 |
False |
r ≤ 1 |
19.1302 |
29.7961 |
27.0669 |
False |
r ≤ 2 |
9.1769 |
15.4943 |
13.4294 |
False |
r ≤ 3 |
1.7008 |
3.8415 |
2.7055 |
False |
Source: Authors.
Based on the results, and considering that the series are I(1), it is possible to analyze short-term relationships using a VAR model in first differences, as well as to perform, alternatively, a cointegration analysis at the level of subsets of the indices.
In line with the above, Table 3 presents the results of all possible combinations of three indices among the four available.
Table 3
Johansen Cointegration Test by Subsets
Indexes |
Statistical Trace |
Critical Value 5% |
Cointegration? |
COLCAP, IGBVL, IPC |
19.8176 |
29.7961 |
False |
COLCAP, IGBVL, IPSA |
22.6330 |
29.7961 |
False |
COLCAP, IPC, IPSA |
24.9843 |
29.7961 |
False |
IGBVL, IPC, IPSA |
19.9139 |
29.7961 |
False |
Source: Authors.
Of the four possible combinations of three MILA indices, in no case did the trace statistic exceed the critical value at 5%; therefore, no statistical evidence of cointegration was found between any subset of three MILA indices.
VAR analysis in early differences
Given an optimal lag of 3 according to the Akaike Information Criterion (AIC), the results of the model are presented in Table 4.
Table 4
Results of the VAR model in first differences with three lags
Dependent variable |
Predictor (laggard) |
Coefficient |
p-value |
COLCAP |
L1. COLCAP |
0.1421 |
0.0000 |
COLCAP |
L1. IPC |
0.0795 |
0.0013 |
COLCAP |
L2. IGBVL |
0.0629 |
0.0006 |
IGBVL |
L1. IPC |
0.0948 |
0.0056 |
IGBVL |
L2. IGBVL |
0.0736 |
0.0037 |
IGBVL |
L3. COLCAP |
0.1141 |
0.0012 |
IGBVL |
L3. IPSA |
-0.0529 |
0.0371 |
IPC |
L1. IGBVL |
0.0734 |
0.0001 |
IPC |
L3. COLCAP |
0.0730 |
0.0056 |
IPC |
L3. IGBVL |
-0.0494 |
0.0096 |
IPSA |
L1. IPC |
0.1430 |
0.0000 |
IPSA |
L1. IPSA |
0.0551 |
0.0280 |
IPSA |
L2. COLCAP |
0.0870 |
0.0131 |
IPSA |
L2. IGBVL |
0.0519 |
0.0372 |
IPSA |
L3. COLCAP |
0.0983 |
0.0045 |
IPSA |
L3. IGBVL |
-0.0510 |
0.0412 |
IPSA |
L3. IPSA |
-0.0598 |
0.0165 |
Source: Authors.
In light of the results, the application of the VAR model reveals significant short-term relationships between the MILA indices, which suggests the existence of transmission of shocks between markets. In particular, the IPC (Mexico) influences the movements of the other indices. However, the absence of cointegration indicates that there is no long-term equilibrium mechanism, which implies that markets evolve in a partially uncoordinated way over time.
Delving deeper into the Cholesky orthogonal impulse-response analysis in order to interpret the effects of structural shocks under the assumption of a contemporary causal order between variables, it should be noted that the first index listed (COLCAP) is considered the most exogenous and the last (IPSA) the most endogenous, with the order being as follows: COLCAP →IGBVL →IPC →IPSA.
In line with the above, a positive shock in the COLCAP index (Colombian market), interpreted as an unanticipated innovation that raises its daily performance, generates immediate and visible responses in the other MILA stock market indices, particularly in the IPC. This suggests that the Mexican market reacts favorably to positive events in Colombia, possibly due to the shared perception of country risk, similar regional macroeconomic conditions or the presence of institutional investors with integrated regional strategies. There is also evidence of a positive reaction in the IGBVL (Figure 2), although more transitory, probably attributed to the sectoral or commercial connection between the two economies, the behavior of Latin American funds or ETFs that replicate regional portfolios, or the degree of synchronization of economic cycles.
On the other hand, the effects of shocks on the IPC are stronger on the IPSA, suggesting an influence of the Mexican market on the Chilean market.
In all cases, responses tend to fade in less than ten days, indicating that the effect is short-term, consistent with financially integrated markets at the margin, but without a long-term structural relationship (absence of cointegration).
Figure 2
Cholesky's Orthogonalized Impulse-Response Functions
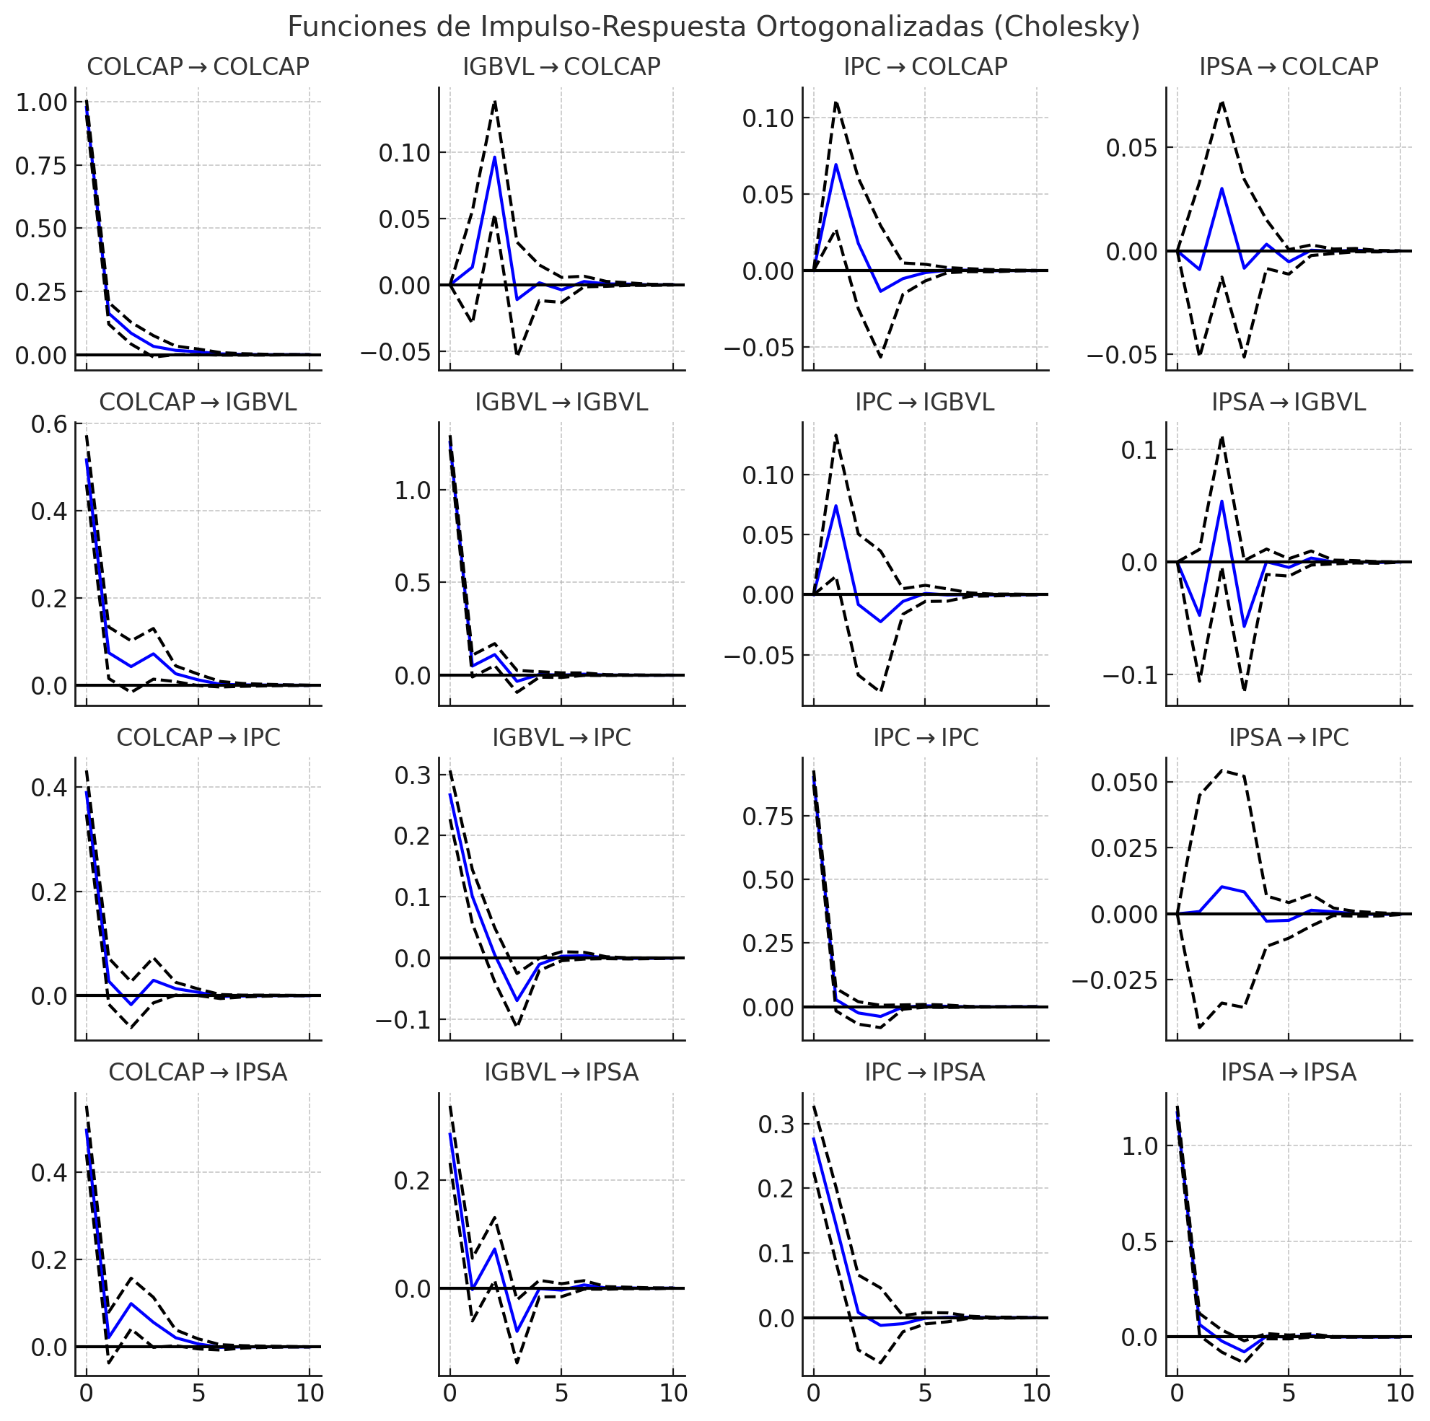
Source: Authors.
Regarding the analysis of the residuals (Figure 3), they show averages close to zero, but they do not strictly follow a normal distribution, which is an expected result in financial data. This does not invalidate the model, but it does imply that the confidence and significance intervals should be interpreted with caution, or reinforced in future research by robust methods, such as bootstrap, GARCH models, among others.
Figure 3
Residue analysis
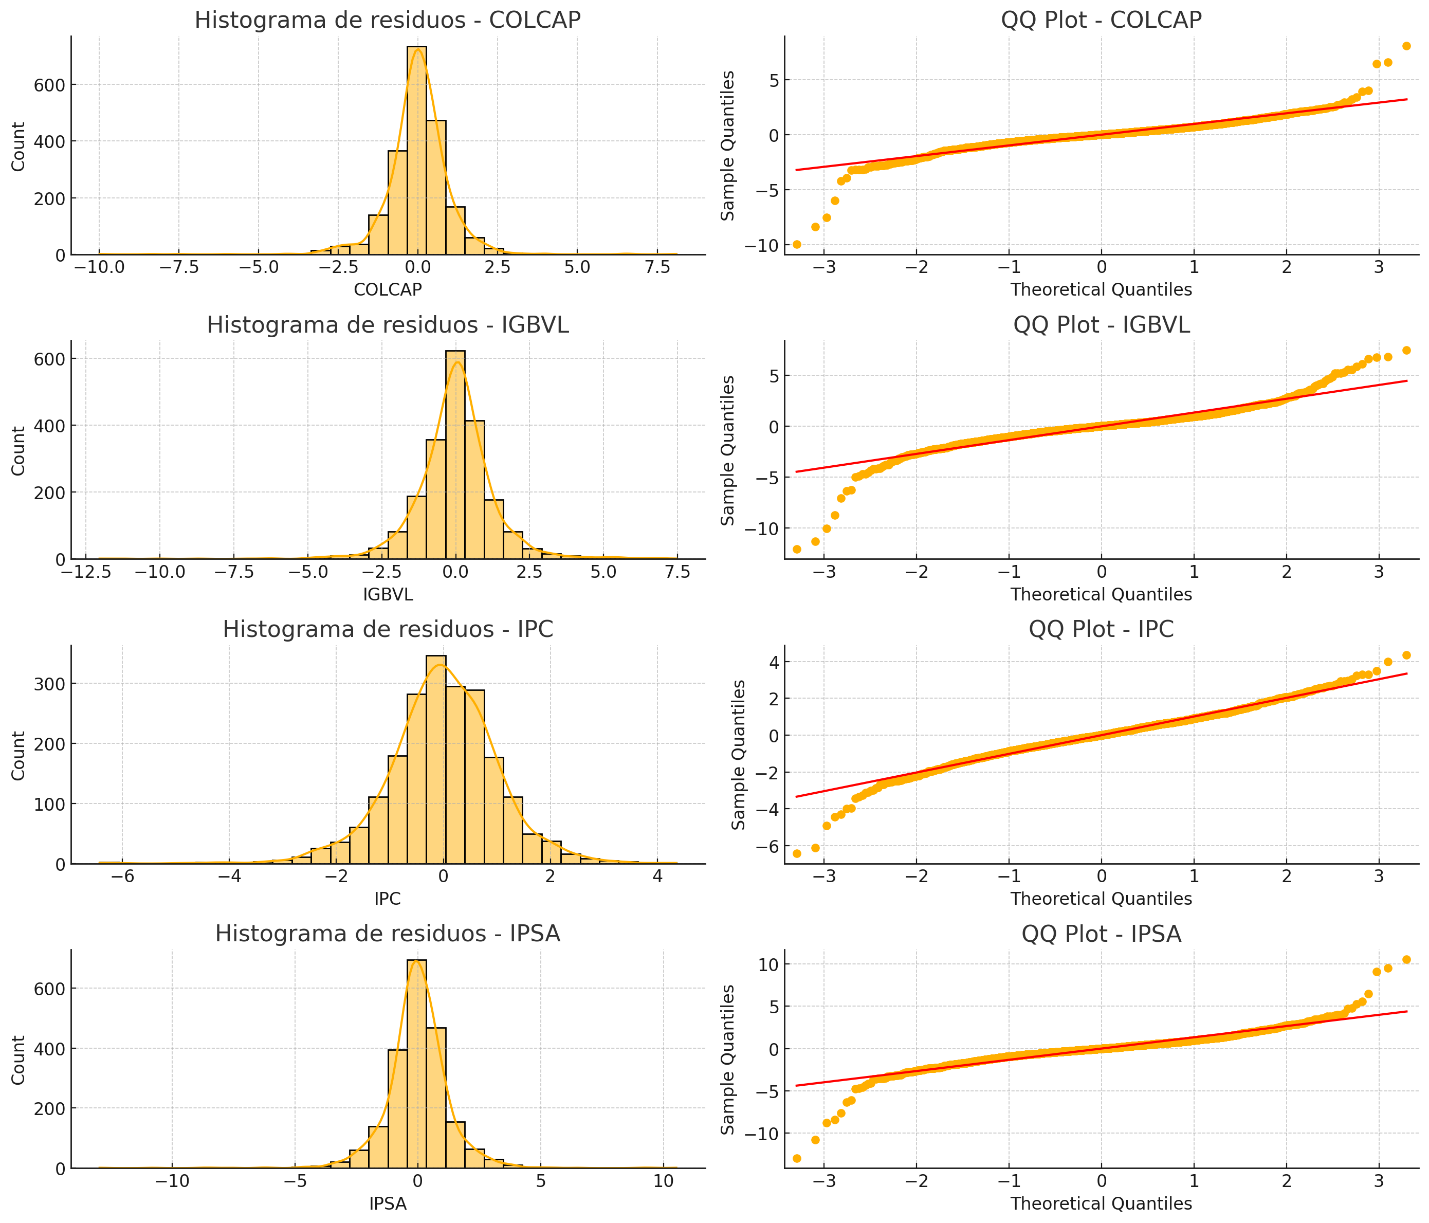
Source: Authors.
Discussion
First, the study confirms the absence of co-integration between MILA stock market indices, which is consistent with research such as that of Endri et al. (2024), who conclude that stock market integration in emerging markets such as Indonesia has a low long-term connection, although with dynamic correlations in the short term. This finding reinforces the idea that financial integration in emerging markets does not necessarily materialize in structural price convergence, but rather in patterns of transitory interdependence.
Likewise, the absence of cointegration and the weak structural integration observed in the MILA are aligned with the results of Lizarzaburu et al. (2015), who showed that, in the first years of implementation of the MILA, no significant improvements were observed in profitability or in the correlation between markets. Along these lines, Hardy et al. (2018) also highlighted that, despite the institutional progress of MILA, the effects on efficiency and liquidity were limited, which is corroborated by the recent data of this study.
In contrast, other studies have suggested stronger links between certain MILA market pairs. For example, Fuentes and Pinilla (2021) identified a more pronounced volatility transmission between Chile and Colombia, while this study finds that the most significant influence in the short term comes from the IPC (Mexico), suggesting a reconfiguration of stock market interrelations in more recent years.
Finally, the dynamic behavior observed through the impulse-response analyses of the VAR in differences also agrees with what was pointed out by Vieito et al. (2024), who argue that herd behavior tends to intensify in contexts of high volatility, generating transitory but significant effects among MILA markets. Thus, the current results reinforce the vision of partial integration, conditioned by conjunctural factors rather than by solid and sustained integration.
Taken together, these updated findings complement and extend the existing literature, by demonstrating that, although MILA markets are not integrated in the long term, there are relevant channels for the transmission of shocks in the short term, which implies challenges and opportunities for regional financial policy.
Conclusions
The analysis carried out shows that the MILA stock indices (COLCAP, IGBVL, IPC and IPSA) are non-stationary series at level and integrated of order one, which validates the use of cointegration techniques and VAR models in first differences for their study.
Despite their membership in a common financial bloc, no evidence of cointegration relationships was found between the four indices or between any subset of three. This shows that MILA markets do not share a long-term joint equilibrium, i.e., they are not fully integrated at the structural level. The evolution of their prices responds more to national dynamics than to sustained regional convergence.
The VAR model in early differences showed significant short-term interactions between the markets. In particular, the IPC (Mexico) and the IGBVL (Peru) exert influence on the others, with impacts that are transmitted transiently and dissipate in less than ten days. This indicates a certain interdependence in the daily dynamics of returns, consistent with the presence of regional financial flows and common reactions to external shocks.
Orthogonalized impulse-response analysis showed that shocks in the COLCAP and IGBVL generate immediate responses in the other markets, especially in the IPC and IPSA, although with temporary effects. This reinforces the hypothesis that there are channels of contagion or synchronized reaction in the short term.
The importance of this research lies in offering updated evidence on the effectiveness of regional financial integration in Latin America, contributing to closing gaps in the literature on its recent behavior. The findings may also be useful for financial authorities and policymakers seeking to strengthen connectivity between exchanges, improve liquidity, and incentivize international investment.
One of the limitations of the study is that the approach of the VAR model is linear, so it does not contemplate possible nonlinearities or structural changes in the relationships between markets. In addition, macroeconomic or institutional variables that could affect the degree of integration were not included. These aspects open up possibilities for future research, incorporating regime-change approaches (Markov Switching), multivariate GARCH models, as well as evaluating the role of institutional investors, exchange rate risk, and high-volatility events in the region.
Ethical considerations
This research did not require approval from a committee because it was based on publicly available information, including stock market index data.
Conflict of interest
All authors made significant contributions to the document and declare that there is no conflict of interest related to this article.
Authors' contribution statement
Luis Enrique Cayatopa-Rivera: Conceptualization, Methodology, Software, Validation, Formal Analysis, Research, Writing—Original Draft, Writing—Review and Editing, Visualization.
Héctor Javier Bendezú-Jiménez: Conceptualization, Writing—Original Draft, Validation.
Funding source
This research was funded with the researchers' own resources.
References
(1) Agudelo, DA, Barraza, S. Castro, M. y Mongrut, S. (2012). Liquidez en los mercados accionarios latinoamericanos: estimando el efecto del mercado integrado latinoamericano (MILA). Center for Research in Economics and Finance (CIEF), Working Papers, (12-21). http://dx.doi.org/10.2139/ssrn.2400734
(2) Camara-Neto, A. F. & Vernengo, M. (2010). Beyond the original sin: a new regional financial architecture in South America. Journal of Post Keynesian Economics, 32(2), 199–212. https://doi.org/10.2753/PKE0160-3477320205
(3) Cardona, J. C. (2024). La integración del mercado bursátil latinoamericano: el caso del mercado integrado latinoamericano. Una revisión sistemática e integración de la literatura. Revista Finanzas y Política Económica, 16(2), 317-353. https://doi.org/10.14718/revfinanzpolitecon.v16.n2.2024.1
(4) Carrieri, F., Errunza, V. & Hogan, K. (2007). Characterizing world market integration through Time. Journal of Financial and Quantitative Analysis, 42(04), 915. https://doi.org/10.1017/S0022109000003446
(5) Cheung, D. W. (2000). The impulse of stock market volatility and the market crash of october 1987. Journal of Business Finance & Accounting, 27(5-6), 761-776. https://doi.org/10.1111/1468-5957.00333
(6) Duwicquet, V. y Mazier, J. (2011). Integración financiera y ajustes macroeconómicos en una unión monetaria. Revista de economía poskeynesiana, 33(2), 333-370. https://doi.org/10.2753/PKE0160-3477330207
(7) Economic Commission for Latin America and the Caribbean. (2014). Integración regional. Hacia una estrategia de cadenas de valor inclusivas. Naciones Unidas. https://repositorio.cepal.org/entities/publication/2336e16c-710b-47e7-bcbe-79c6c0539ede
(8) Enders, W. (2014). Applied Econometric Time Series (14ª ed.). Wiley. https://acortar.link/atFCQd
(9) Endri, E., Fauzi, F. & Syafriana, M. (2024). Integration of the Indonesian stock market with eight major trading partners’ stock markets. Economies, 12(12), 350. https://doi.org/10.3390/economies12120350
(10) Espinoza, R., Prasad, A. & Williams, O. (2011). Regional financial integration in the GCC. Emerging Markets Review, 12(4), 354–370. https://doi.org/10.1016/j.ememar.2011.04.005
(11) Fama, E. F. (1995). Random Walks in Stock Market Prices. Financial Analysts Journal, 51(1), 75–80. https://doi.org/10.2469/faj.v51.n1.1861
(12) Frey, L. & Volz, U. (2013). Regional financial integration in Sub-Saharan Africa–an empirical examination of its effects on financial market development. South African Journal of Economics, 81(1), 79-117. https://doi.org/10.1111/j.1813-6982.2012.01334.x
(13) Fuentes, M. y Pinilla, A. (2021). Transmisión de volatilidad en el mercado integrado latinoamericano (MILA): Una evidencia del grado de integración. Revista de Métodos Cuantitativos para la Economía y la Empresa, 31, 301-328. https://doi.org/10.46661/revmetodoscuanteconempresa.4182
(14) Grobys, K. (2010). Have volatility spillover effects of cointegrated European stock markets increased over time? The review of finance and banking, 2(2), 083-94. https://www.ceeol.com/search/article-detail?id=848745
(15) Gur, N. (2013). Does financial integration increase exports? evidence from international industry-level data. Emerging Markets Finance and Trade, 49(SUP5), 112–129. https://doi.org/10.2753/REE1540-496X4905S507
(16) Hardy, N., Magner, N. S., Lavín, J., Cárdenas, R. A. & Jara-Bertin, M. (2018). Small consequences of a major agreement: The MILA case. Academia Revista Latinoamericana de Administración, 31(4), 663-683. https://doi.org/10.1108/ARLA-12-2017-0357
(17) Hyme, P. (2003). La teoría de los mercados de capitales eficientes. un examen crítico. Cuadernos de Economía, 22(39), 57–83. http://www.scielo.org.co/scielo.php?pid=s0121-47722003000200004&script=sci_arttext
(18) Investing.com. (2024). Mercados financieros del mundo. https://es.investing.com/markets/
(19) Johansen, S. (1988). Statistical analysis of cointegration vectors. Journal of Economic Dynamics and Control, 12(2–3), 231–254. https://doi.org/10.1016/0165-1889(88)90041-3
(20) Johansen, S. (1991). Estimation and Hypothesis Testing of Cointegration Vectors in Gaussian Vector Autoregressive Models. Econometrica, 59(6), 1551–1580. https://doi.org/10.2307/2938278
(21) Kim, S. & Lee, J. W. (2012). Real and financial integration in east Asia. Review of International Economics, 20(2), 332–349. https://doi.org/10.1111/j.1467-9396.2012.01025.x
(22) Lee, H.H., Huh, H.S. & Park, D. (2013). Financial Integration in East Asia: An Empirical Investigation. The World Economy, 36(4), 396–418. https://doi.org/10.1111/twec.12030
(23) Lizarzaburu, E. R., Burneo, K., Galindo, H. & Berggrun, L. (2015). Emerging Markets Integration in Latin America (MILA) Stock Market indicators: Chile, Colombia and Peru. Journal of Economics, Finance and Administrative Science, 20(39), 74–83. https://doi.org/10.1016/j.jefas.2015.08.002
(24) Lütkepohl, H. & Krätzig, M. (2004). Applied time series econometrics. Cambridge University Press. https://doi.org/10.1017/CBO9780511606885
(25) Markowitz, H. (1952). Portfolio Selection. The Journal of Finance, 7(1), 77–91. https://doi.org/10.1111/j.1540-6261.1952.tb01525.x
(26) Muñoz, J. A., Sepúlveda, S. M., Velosos, C. L. & Delgado, C. L. (2022). Effects of MILA on their stock markets: An empirical analysis on market activity and dynamic correlations. International Journal of Emerging Markets, 17(5), 1189-1215. https://doi.org/10.1108/IJOEM-12-2019-1070
(27) Ocampo, J. A. & Titelman, D. (2010). Subregional financial cooperation: the South American experience. Journal of Post Keynesian Economics, 32(2), 249–268. https://doi.org/10.2753/PKE0160-3477320208
(28) Pérez, P. P. (2010). The Ecuadorian proposal for a new regional financial architecture. Journal of Post Keynesian Economics, 32(2), 163–172. https://doi.org/10.2753/PKE0160-3477320202
(29) Santillán-Salgado, R. J., Massa, R. & Reyna, M. (2017). An exploratory study on nonlinear causality among the MILA markets. Emerging Markets Finance and Trade, 53(10), 2303-2317. https://doi.org/10.1080/1540496X.2017.1308861
(30) Schmiedel, H. & Schönenberger, A. (2005). Integration of securities market infrastructures in the euro area. ECB Occasional Paper, (33). http://dx.doi.org/10.2139/ssrn.752093
(31) Seraylán, M. (2014). La integración de mercados y depositarios centrales: experiencia del MILA. En Instituto Iberoamericano de Mercados de Valores (Ed.), Estudio sobre los sistemas de registro, compensación y liquidación de valores en Iberoamérica (pp. 215–232). Instituto Iberoamericano de Mercados de Valores. https://www.iimv.org/wp-content/uploads/2014/11/CAPITULO-7.pdf
(32) Serrano, R. & Núñez, J. A. (2021). Value-at-risk predictive performance: A comparison between the CaViaR and GARCH models for the MILA and ASEAN-5 stock markets. Journal of Economics, Finance and Administrative Science, 26(52), 197-221. https://doi.org/10.1108/JEFAS-03-2021-0009
(33) Sims, C. A. (1980). Macroeconomics and Reality. Econometrica, 48(1), 1-48. https://doi.org/10.2307/1912017
(34) Sosa, M., Ortiz, E. & Cabello, A. (2018). Dynamic linkages between stock market and exchange rate in MILA countries: a markov regime switching approach (2003-2016). Análisis Económico, 33(83), 57-85. https://www.redalyc.org/journal/413/41356919004/html/
(35) Traczyk, A. (2012). Financial integration and the term structure of interest rates. Empirical Economics, 45(3), 1267–1305. https://doi.org/10.1007/s00181-012-0652-7
(36) Vieito, J. P., Espinosa, C., Wong, W.K., Batmunkh, M.U., Choijil, E. & Hussien, M. (2024). Herding behavior in integrated financial markets: The case of MILA. International Journal of Emerging Markets, 19(11), 3801-3827. https://doi.org/10.1108/IJOEM-08-2021-1202
(37) Volz, U. (2013). ASEAN Financial integration in the light of recent European experiences. Asean Economic Bulletin, 30(2), 124. https://doi.org/10.1355/ae30-2b
(38) You, J., Liu, C. & Du, G. (2014). With economic integration comes financial contagion? evidence from China. Emerging Markets Finance and Trade, 50(3), 62–80. https://doi.org/10.2753/REE1540-496X500305