https://doi.org/10.22267/rtend.252602.282
Review article
Finance
Analysis of financial disparities in municipalities of the department of Cesar, Colombia: a longitudinal study (2019–2023)
Análisis de las disparidades financieras en municipios del departamento del Cesar, Colombia: un estudio longitudinal (2019–2023)
Análise das disparidades financeiras nos municípios do departamento de Cesar, Colômbia: um estudo longitudinal (2019-2023)
By: 1Genjis Alberto Ossa González![]()
1 Master's Degree in Data Science - Pontificia Universidad Javeriana. Professor, Universidad Popular del Cesar. ORCID: 0000-0002-8194-0859. E-mail: gossa@unicesar.edu.co, Aguachica -Colombia.
How to cite this article: Ossa, G. (2025). Analysis of financial disparities in municipalities of the department of Cesar, Colombia: a longitudinal study (2019–2023). Tendencias, 26(2), 241-271. https://doi.org/10.22267/rtend.252602.282
Received: April 21, 2025
Accepted: June 19, 2025
![]()
Abstract
Introduction: This study analyzes the evolution of public revenues and expenditures in eight municipalities of the department of Cesar, Colombia, between 2019 and 2023, paying special attention to local fiscal dynamics and their relationship with social indicators such as Unsatisfied Basic Needs (UBN). Objective: To analyze financial disparities in municipalities in the department of Cesar. Methodology: A descriptive-comparative approach was applied based on the analysis of budget and population data. The sources of income and the destinations of expenditure in each municipality were observed and contrasted throughout the study period. Results: Municipalities with larger populations do not always generate more of their own income. Becerril and La Jagua de Ibirico stand out for their income from the exploitation of natural resources, while Agustín Codazzi shows a high dependence on royalties. A positive correlation was found between public social expenditure per capita and tax revenues, and based on the descriptive statistical analysis, it is observed that higher expenditure does not guarantee improvements in the UBN. Conclusions: The efficiency and quality of social spending are fundamental, since some municipalities, such as Aguachica and San Alberto, show stability in their financing, while others such as Becerril and Agustín Codazzi present significant variability, which reflects differences in their capacity for self-financing.
Keywords: economic development, income distribution, open data, economy, finance.
JEL: E64; G00; H27; H71; R1.
Resumen
Introducción: Este estudio analiza la evolución de los ingresos y gastos públicos en ocho municipios del departamento del Cesar, en Colombia, entre 2019 y 2023, prestando especial atención a la dinámica fiscal local y su relación con indicadores sociales como las Necesidades Básicas Insatisfechas (NBI). Objetivo: Analizar las disparidades financieras en municipios del departamento del Cesar. Metodología: Se aplicó un enfoque descriptivo-comparativo basado en el análisis de datos presupuestales y poblacionales. Se observaron y contrastaron las fuentes de ingreso y los destinos del gasto en cada municipio a lo largo del período de estudio. Resultados: Los municipios con mayor población no siempre generan más ingresos propios. Becerril y La Jagua de Ibirico sobresalen por sus ingresos provenientes de la explotación de recursos naturales, mientras que Agustín Codazzi evidencia una alta dependencia de las regalías. Se encontró una correlación positiva entre el gasto público social per cápita y los ingresos fiscales, así mismo y con fundamento en el análisis estadístico descriptivo, se observa que un mayor gasto no garantiza mejoras en el NBI. Conclusiones: La eficiencia y calidad del gasto social resultan fundamentales, ya que algunos municipios, como Aguachica y San Alberto, muestran estabilidad en su financiación, mientras que otros como Becerril y Agustín Codazzi presentan variabilidad significativa, lo que refleja diferencias en su capacidad de autofinanciamiento.
Palabras clave: desarrollo económico, distribución del ingreso, datos abiertos, economía, finanzas.
JEL: E64; G00; H27; H71; R1.
Resumo
Introdução: Este estudo analisa a evolução das receitas e despesas públicas em oito municípios do departamento de Cesar, na Colômbia, entre 2019 e 2023, prestando especial atenção à dinâmica fiscal local e sua relação com indicadores sociais como as Necessidades Básicas Insatisfeitas (NBI). Objetivo: Analisar as disparidades financeiras nos municípios do departamento de Cesar. Metodologia: Foi aplicado um enfoque descritivo-comparativo baseado na análise de dados orçamentários e populacionais. Foram observadas e contrastadas as fontes de receita e os destinos da despesa em cada município ao longo do período de estudo. Resultados: Os municípios com maior população nem sempre geram mais receitas próprias. Becerril e La Jagua de Ibirico destacam-se por suas receitas provenientes da exploração de recursos naturais, enquanto Agustín Codazzi evidencia uma alta dependência das receitas de royalties. Foi encontrada uma correlação positiva entre o gasto público social per capita e as receitas fiscais; da mesma forma, com base na análise estatística descritiva, observa-se que um maior gasto não garante melhorias no NBI. Conclusões: A eficiência e a qualidade do gasto social são fundamentais, uma vez que alguns municípios, como Aguachica e San Alberto, apresentam estabilidade em seu financiamento, enquanto outros, como Becerril e Agustín Codazzi, apresentam variabilidade significativa, refletindo diferenças em sua capacidade de autofinanciamento.
Palavras-chave: desenvolvimento econômico, distribuição de renda, dados abertos, economia, finanças.
JEL: E64; G00; H27; H71; R1.
Introduction
Financial disparities between territorial entities are a topic of interest and analysis in the economic and political sphere. In general, municipalities and departments have different levels of financial resources to fulfill their responsibilities and projects; however, there are differences that can be attributed to various factors, such as the capacity to collect taxes and other own revenues, as well as to the allocation of resources by the departmental and national governments (Grupo de Análisis al Financiamiento del Desarrollo Territoriall [GAFDT], 2005).
The history of inequalities, especially in income and expenditure between the central government and subnational governments, is constructed from two concepts: vertical and horizontal inequalities. Vertical inequalities refer to differences in the distribution of resources, income, or power between different hierarchical levels within a social or economic structure (Solís, 2013). In the context of territorial entities, these inequalities can manifest themselves in the way in which the national government distributes resources to regional and local governments, generating significant variations in the availability of funds and opportunities among these entities.
On the other hand, horizontal inequalities are related to the gaps between the spending needs and the fiscal capacity of the different jurisdictions (Martinez & Searle, 2007; Porto & Rosales, 2008). This situation occurs in territories with limited fiscal capacity, as a result of factors such as a weaker tax base, lower own revenues or lower economic activity. At the same time, these jurisdictions may have greater spending needs due to a larger population, high poverty rates, or specific infrastructure and public service requirements.
Based on the above, the literature has highlighted the relevance of implementing fiscal discipline actions in local administrations. Pérez et al. (2021) argue that the condition of territorial entities influences the country's fiscal situation. This can be explained by the possibility that fiscal difficulties are transferred between levels of government, in this case, from subnational to the national government (vertical externalities). Second, there are horizontal externalities, which occur when a subnational government's fiscal position affects its peers, either due to trade linkages or geographic proximity.
Studies such as those by Bonet (2004) and Romero and Delgado (2021) conclude that the process of fiscal decentralization in Colombia during the nineties increased regional disparities in income, given the low performance in terms of fiscal capacity and taxation. This was due to the allocation of resources mostly to current spending, rather than infrastructure, which limited the positive impact on regional development. In addition, the lack of adequate redistributive approaches in national transfers, the absence of incentives for efficient use of resources by subnational governments, and their limited institutional capacity also contributed to these disparities.
Another relevant study is that of GAFDT (2005), which identified disparities in the ability to raise resources. This capacity is attributed to economic structures in which larger cities with more robust economies have greater fiscal capacity compared to less developed areas. However, it could also be due to the fact that municipalities are provided with natural resources in different proportions, both in quality and quantity (Guerrero, 2014).
In addition, it was observed that higher social spending compared to investment in infrastructure limits the generation of local income. However, studies such as those by Aschauer (1989), Barro (2001), and the World Bank (2013) argue that, when public spending is directed towards areas that promote economic and social development, this action can activate a positive cycle, in which a more robust economy increases the government's capacity to collect taxes.
However, studies such as those by Bonet and Ayala (2015; 2016) estimate that transfers reduce horizontal fiscal disparities in both municipalities and departments, with a more significant effect on municipalities. However, it has been found that the Sistema General de Participaciones (General System of Participations, SGP), contributes to reducing disparities and improving the level of municipal development (Ariza et al., 2023), while the Sistema General de Regalías (General System of Royalties, SGR) tends to increase fiscal inequality.
For their part, authors such as Martínez (2006), Bonet and Meisel (2007), and Betancurt (2002, as cited in Barajas and Casas, 2020) argue that decentralization has failed to reduce inequality in tax revenues, generating significant gaps between territories. This paradoxically contrasts with what Gamarra (2005) and Rentería et al. (2007) have argued, who argue that resources from royalties should improve the quality of life of Colombians and satisfy Unsatisfied Basic Needs (UBN) in education, health, drinking water and sewerage, in addition to reducing infant mortality and investing in other productive and high-impact initiatives in the regions.
Certainly, royalties represent a special component in terms of compensation for the exploitation of resources in the territories, and the department of Cesar, in Colombia, is one of those that receives the highest compensation per capita for the exploitation of hydrocarbons (Observatorio Fiscal de la Pontificia Universidad Javeriana, 2023). Bonet (2007) pointed out that the departmental government's royalties went from representing 8.7% of its total income in 2000 to 25.8% in 2005. During the study period, the department started with a percentage of 23% and by 2023 it reached 46.7%, maintaining an average of 25.5%.
Likewise, it is possible to show that, from the added value of the municipalities, historically there has been a preponderance of primary activities; however, there are exceptions, such as the municipalities of Aguachica, San Alberto and Chiriguaná.
In Bonet's (2007) study, it was already concluded that a large part of the investment boom that the department of Cesar was experiencing was supported (Tables 1 and 3) by external sources (royalties and SGP). Likewise, it was recommended to generate greater local taxation to sustain this pace of investments in the long term, once the department's non-renewable natural resources are exhausted. In addition, and in line with Bonet's (2005) research, it was found, through the estimation of an interregional input-output model, that mining was a sector with very weak linkages with other sectors of the economy.
This work is structured as follows: section II presents the methodology and data sources used; section III presents the main findings of the analysis; in section IV the discussion of the results is developed; and, finally, section V presents the conclusions of the study.
Methodology
This study adopts a descriptive and comparative approach that uses administrative data from two main sources. First, the income statements of the territorial entities, obtained from the Consolidador de Hacienda e Información Pública (Consolidator of Finance and Public Information, CHIP), corresponding to the period 2019–2023, are used. Second, population projections and georeferenced frameworks provided by the Departamento Administrativo Nacional de Estadística (National Administrative Department of Statistics, DANE) are used, based on the 2018 national census.
From this information, the degree of inequality in transfers and subsidies is inferred by calculating the Gini index, complemented with other descriptive statistical tools. The territorial entities included in the analysis were selected according to population criteria, prioritizing the municipalities that are part of the old mining corridor of the department, as well as those located in the south of Cesar with the largest number of inhabitants.
Regarding the limitations, it is stated that it works with population assumptions, by adopting the official DANE projections, based on the 2018 census. It should be clarified that the monetary values used in the analysis are presented in their nominal form; that is, they have not been adjusted by deflators, nor transformed at constant prices, but are used as they were originally reported in the financial reports of each year.
In relation to Figure 1, a geographical representation of the department of Cesar is presented, in which the municipalities included in the analysis are identified. On the left side of the map, the department is delimited in its entirety, while on the right side the municipalities selected for the study are specifically highlighted. In the south of the department are Aguachica, San Alberto and San Martín, while in the north-central area are Agustín Codazzi, Becerril, La Jagua de Ibirico, El Paso and Chiriguaná. This figure allows us to visualize the strategic location of each municipality within the regional context.
Figure 1
Municipalities of the department of Cesar selected
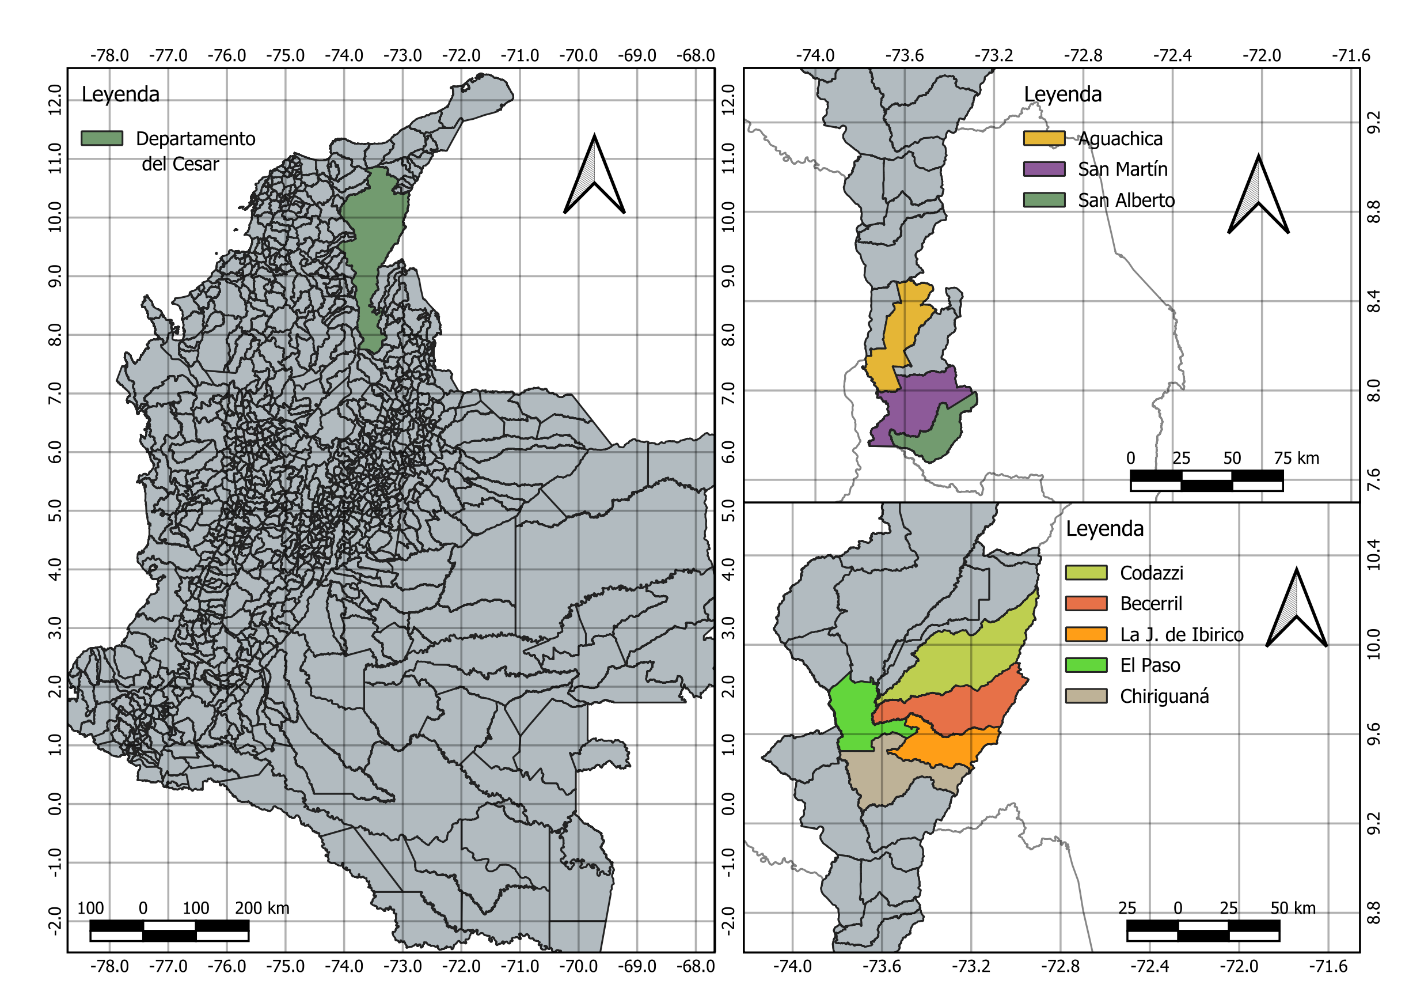
Source: Authors' elaboration with data from DANE (2018c).
Results
This section presents the main findings of the financial analysis carried out on the selected municipalities of the department of Cesar between 2019 and 2023. The dynamics of public income and expenditure are described and compared, with special emphasis on own, fiscal and royalty revenues, as well as on the structure of administrative and social expenditure. Through different visualizations, it seeks to illustrate the disparities between territories in terms of their capacity to generate revenue and fiscal sustainability. Figure 2 shows the evolution of total revenues and their composition (fiscal, own and transfers) in the set of municipalities analysed; likewise, this information can be evidenced in Annex 1.
Figure 2
Income and types of income by all municipalities
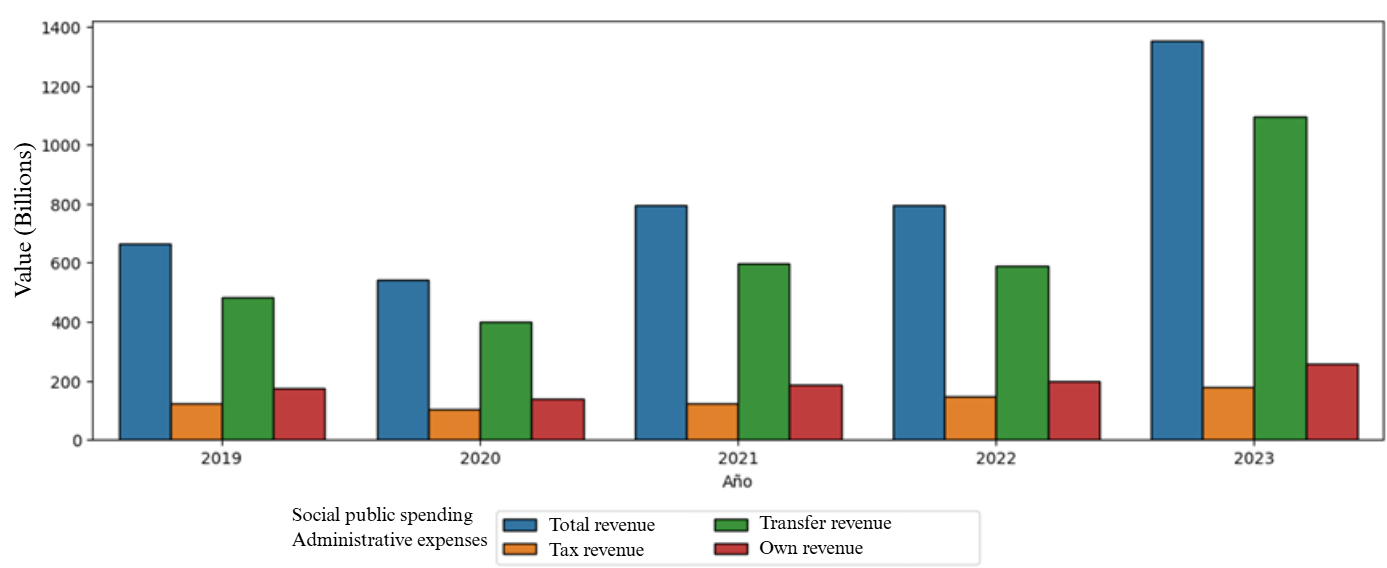
Source: Own elaboration with data from CHIP (2024).
Figure 3 presents in detail the distribution of the types of expenditure in the municipalities analyzed, allowing us to observe not only the magnitude, but also the evolution and relative trend of expenditure on administration and public social expenditure throughout the period studied.
Figure 3
Expenditure and types of expenditure by all municipalities
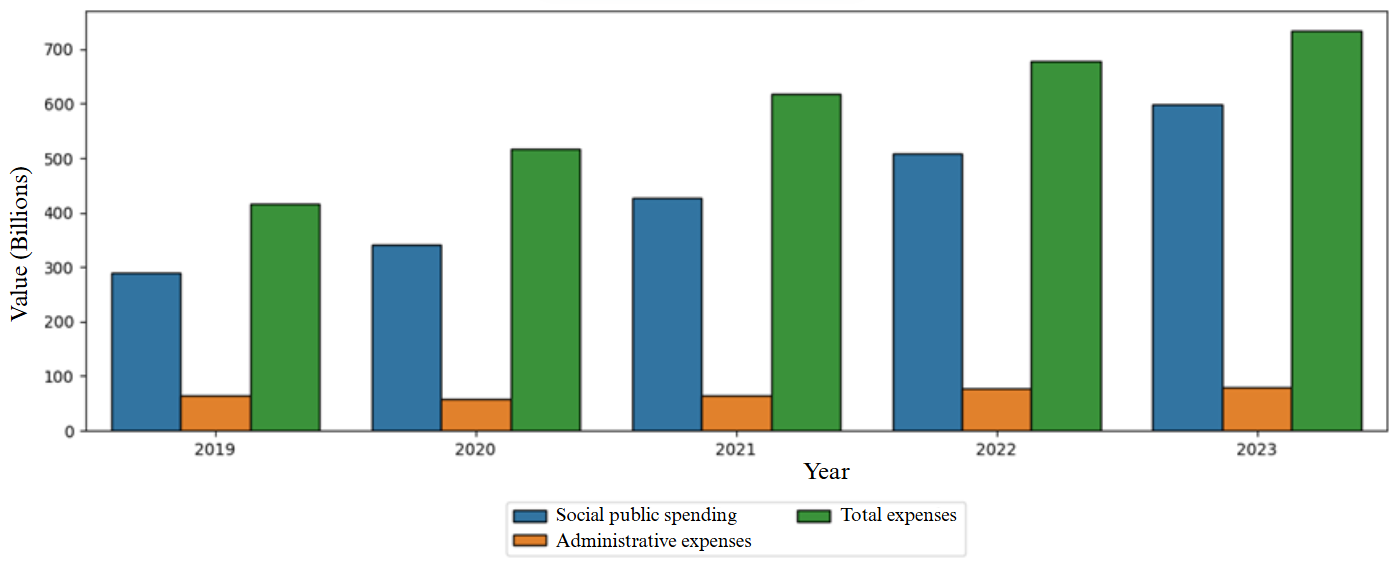
Source: Own elaboration with data from CHIP (2024).
According to Table 1, it is evident that, historically, the territorial entities with the highest generation of own income on average, that is, discounting the items for transfers and subsidies, are the Jagua de Ibirico, Becerril and Aguachica. However, this situation could be related to the population size of each municipality, as illustrated in Figure 4, which presents the cumulative population between 2019 and 2023.
Table 1
Own income of the municipality and department
Region |
2019 |
2020 |
2021 |
2022 |
2023 |
Cesar |
300.277.578.874 |
306.927.363.320 |
329.303.737.350 |
393.778.928.975 |
434.706.207.273 |
Aguachica |
21.237.514.478 |
21.936.230.770 |
22.987.936.504 |
25.684.867.599 |
29.068.825.991 |
Chiriguaná |
16.493.081.971 |
16.254.942.193 |
16.543.418.255 |
13.383.000.421 |
13.606.497.002 |
El Paso |
19.127.035.348 |
16.487.376.032 |
16.410.139.413 |
21.545.055.814 |
3.687.757.775 |
Becerril |
19.222.789.366 |
8.258.316.804 |
11.246.467.872 |
21.661.189.278 |
64.599.802.148 |
San Martin |
17.085.342.060 |
13.514.503.081 |
12.458.967.068 |
19.965.234.728 |
32.508.240.691 |
Agustín Codazzi |
6.988.190.763 |
14.132.092.064 |
15.797.574.490 |
24.213.591.639 |
32.891.448.609 |
San Alberto |
8.405.390.741 |
6.519.744.429 |
7.955.216.661 |
10.448.464.865 |
14.404.423.060 |
La Jagua de Ibirico |
48.293.777.918 |
28.142.854.207 |
70.785.158.808 |
40.560.278.428 |
35.552.962.026 |
Source: Own elaboration with data from CHIP (2024).
Based on the above, it can be seen in Figure 4 that municipalities with larger populations do not necessarily have a greater capacity to generate their own income. A clear example of this is Becerril, which, despite having a relatively low population, has proven to be the municipality with the highest average income during the period 2019 - 2023.
Figure 4
Cumulative population 2019 – 2023 municipalities of the department of Cesar
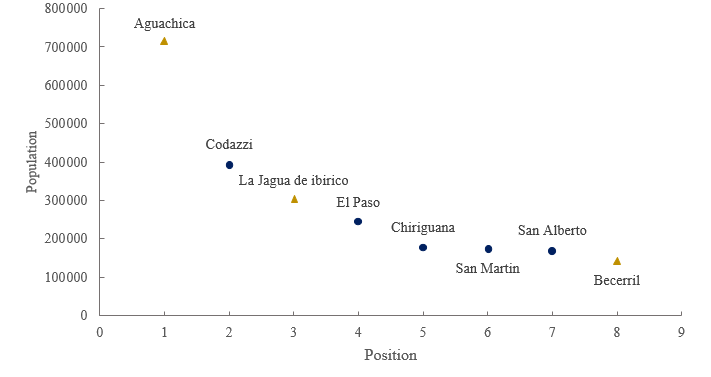
Source: Authors' elaboration with data from DANE (2018a).
However, this situation could also be influenced by revenues from taxation for hydrocarbon exploitation, given that these regions have coal mines located in the central area of the department (Gamarra, 2005), also known as the mining corridor.
On the other hand, when looking at the added value of the municipalities, which consists of the greater value created in the production process as a result of the combination of factors and is obtained as the difference between the value of gross production and the intermediate consumption used; in this context, it is evident in Figure 5 that Becerril is the municipality with the highest accumulated value added, standing out for substantial growth, especially in the years 2021 and 2022. For a more detailed analysis, see Annex 2.
Figure 5
Historical added value of the municipalities
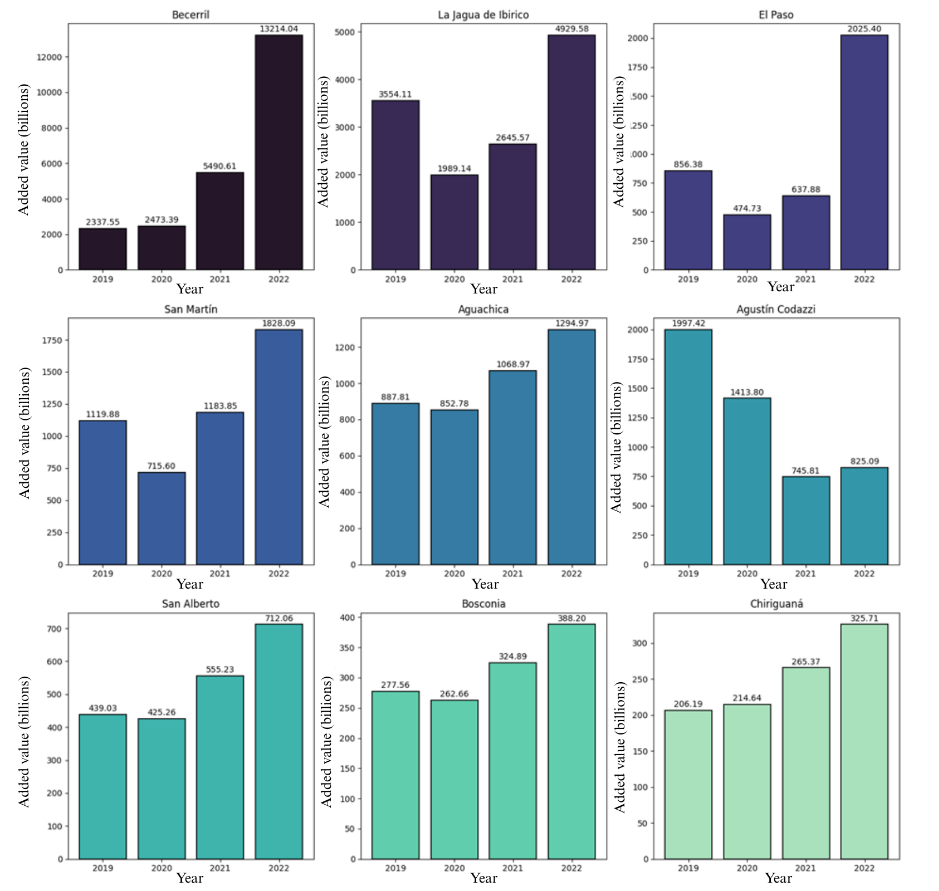
Source: Authors' elaboration with data from DANE (2022).
La Jagua de Ibirico ranks second after Becerril, with considerable added value and a notable recovery after the fall recorded in 2020. Although it presents a downward trend, Agustín Codazzi retains a relevant position in cumulative terms, followed by San Martín. The case of Aguachica is surprising, which, despite being the most populous municipality in the group analyzed, ranks fifth in total value added.
Figure 6 shows the variations in tax revenues, total revenues, and royalty revenues in several municipalities and in the department of Cesar. In municipalities such as San Martín, an inverse relationship is observed between total revenues and royalties with respect to tax revenues. A similar trend can be seen in the department of Cesar, where, in 2022 and 2023, tax revenues show an inverse variation with respect to total revenues and royalties. In El Paso, the variations in tax revenues are also inverse to those in royalty revenues.
Figure 6
Relative change in tax revenues, total revenues and royalties
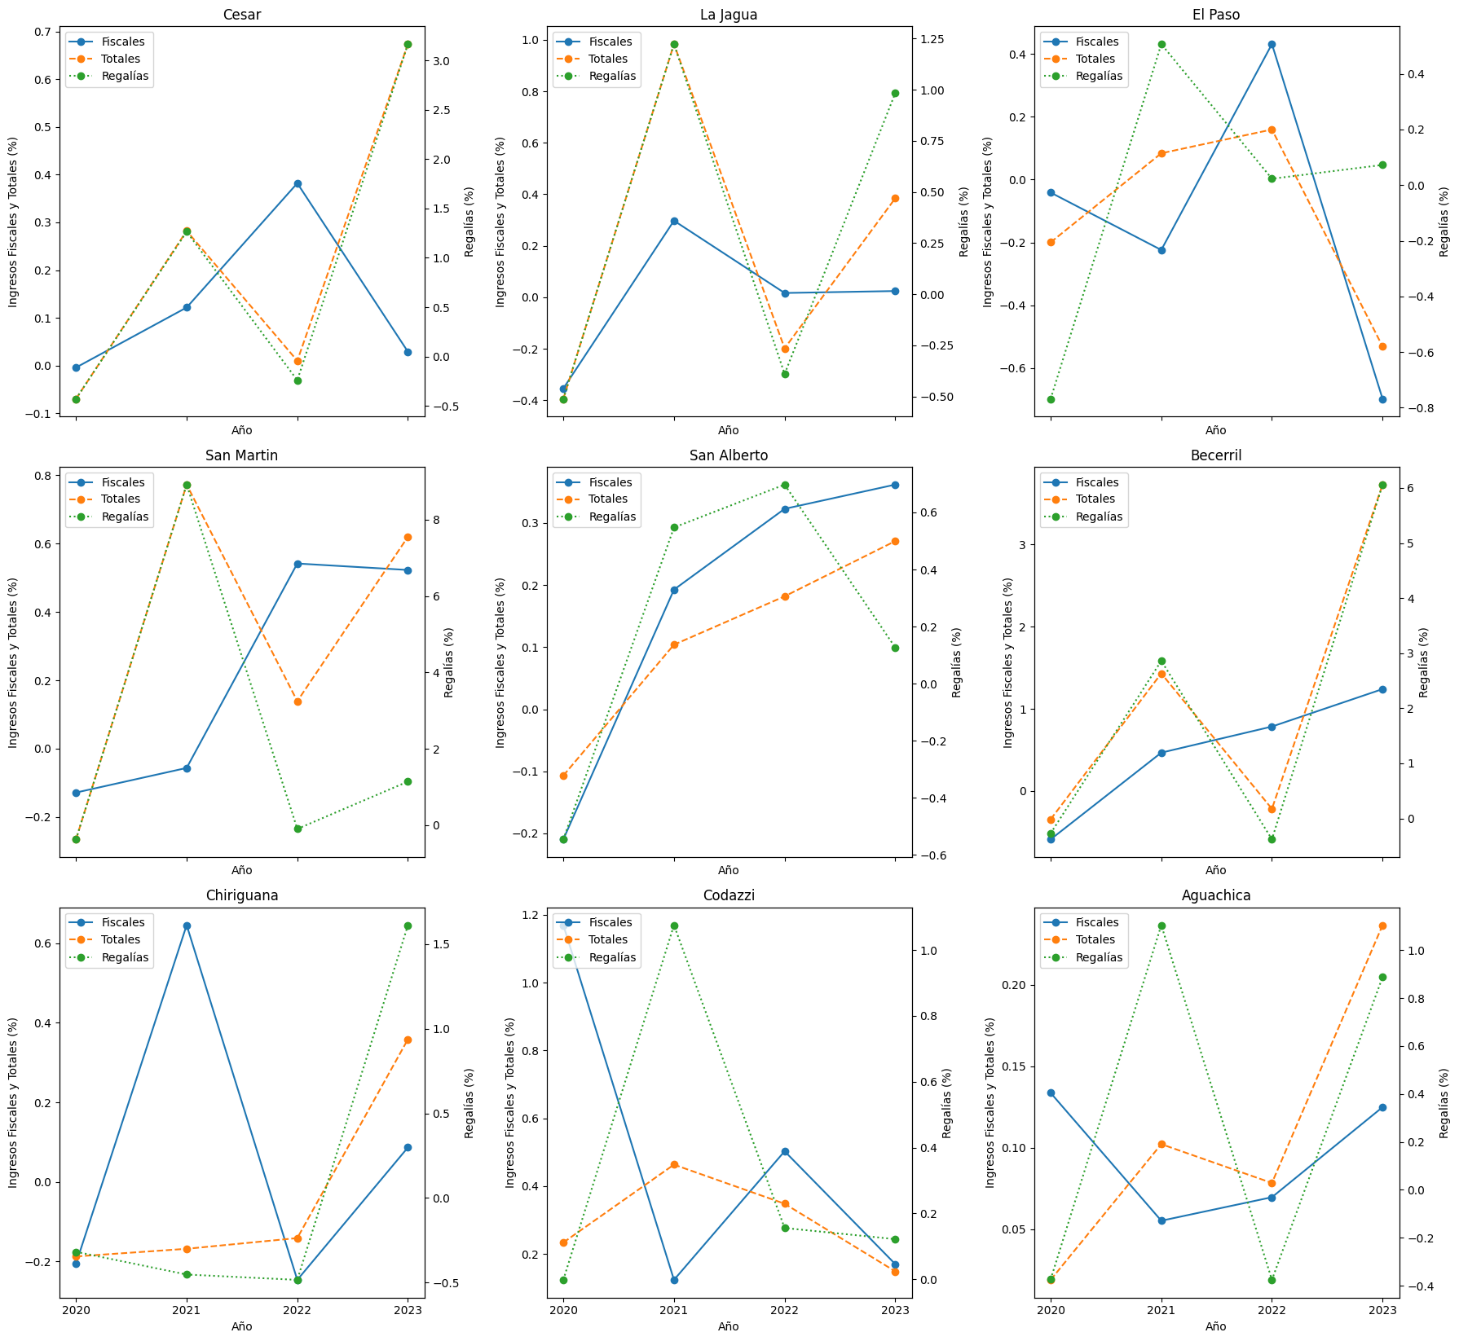
Source: Own elaboration with data from CHIP (2024).
However, there is a visible relationship between total income and royalties in municipalities such as Aguachica, Agustín Codazzi, Becerril, La Jagua de Ibirico and the department of Cesar. In 2023, a particularity is observed in San Alberto, where as revenues from hydrocarbon exploitation decrease, tax and total revenues increase.
According to Figure 7, the accumulation of transfers shows that Becerril and La Jagua de Ibirico have a strong dependence on royalties, while Aguachica presents high transfers from the GSP and the Social Security System. Municipalities such as San Alberto and El Paso receive low amounts of royalties, which shows fewer links with extractive activities. For more details, see Annex 3.
Figure 7
Cumulative transfers and subsidies by municipality and by concept
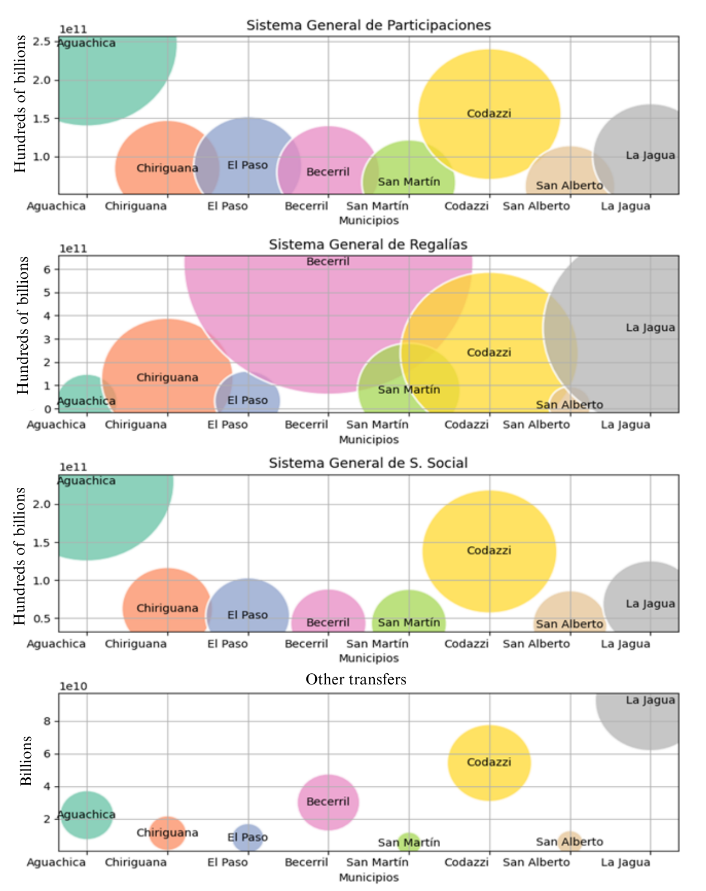
Source: Own elaboration with data from CHIP (2024).
In relation to Table 2, on the dependence of territorial entities with respect to royalty revenues, Becerril exhibits a growing and significant dependence on royalty income, reaching its peak in 2023 with 81%.
Table 2
Level of dependence of territorial entities on royalty revenues
| Region |
2019 |
2020 |
2021 |
2022 |
2023 |
|---|---|---|---|---|---|
Cesar |
23,0% |
14,1% |
24,9% |
18,8% |
46,7% |
Aguachica |
4,8% |
3,0% |
5,6% |
3,3% |
5,0% |
Chiriguaná |
50,2% |
42,1% |
27,7% |
16,6% |
32,0% |
El Paso |
22,6% |
6,6% |
9,1% |
8,0% |
18,4% |
Becerril |
38,6% |
43,0% |
68,3% |
54,2% |
81,0% |
San Martin |
7,4% |
6,4% |
35,6% |
28,3% |
37,4% |
Agustín Codazzi |
35,5% |
28,7% |
40,7% |
34,9% |
34,1% |
San Alberto |
9,3% |
4,7% |
6,6% |
9,5% |
8,4% |
La Jagua de Ibirico |
46,7% |
37,7% |
42,2% |
32,2% |
46,1% |
Source: Own elaboration with data from CHIP (2024).
Agustín Codazzi has a significant dependence on royalties, although with some variations over the years. Its dependence is less pronounced than that of Becerril, but it is still considerable, exceeding 30% in most years. This allows us to infer that these economies are influenced by royalties, which may represent a risk in the event of variations in the international prices of these commodities.
In relation to inequalities, we can bring up the Gini index, which is a measure of income inequality within a population, where a value of 0 represents perfect equality and a value of 1 expresses maximum inequality. When analyzing the index, as illustrated in Figure 8, with respect to municipalities in relation to income from transfers and subsidies (royalties, the GSP and the Social Security System), a relative constancy in the indicator is observed throughout the period studied. This index has remained between 0.39 and 0.43 for the last five years.
Figure 8
Gini index of income from transfers and subsidies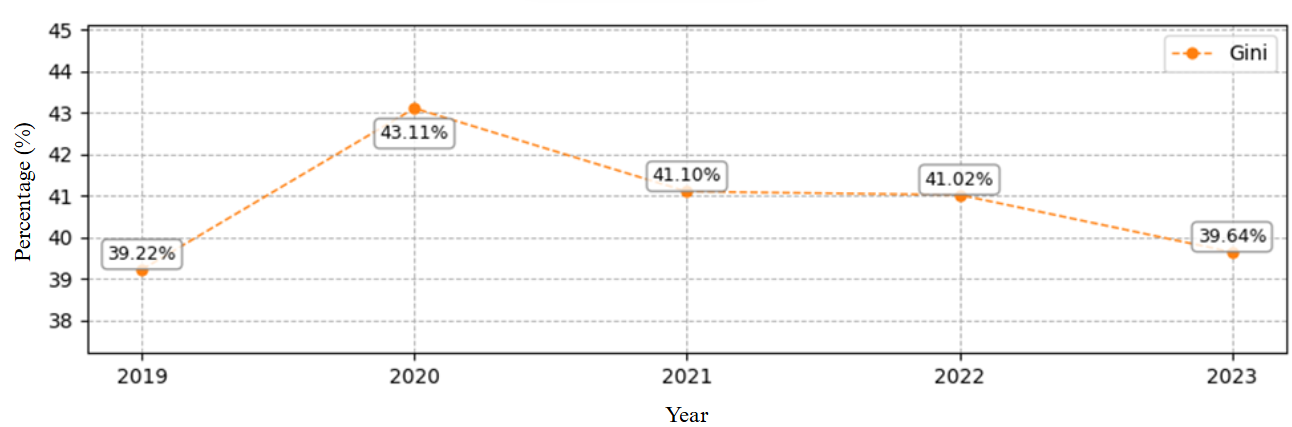
Source: Authors' elaboration with data from CHIP (2024) and DANE (2018a).
Perfect equality, according to González (2020), represents an ideal situation in which all individuals or territories receive income in equal proportions, which is graphically reflected in the perfect equality line of the Lorenz Curve. When contrasting this line with the real curves observed between 2019 and 2023 in Figure 9, and with the data in Table 4, there is evidence of significant inequality in the distribution of tax revenues.
Figure 9
Lorenz curves of transfer and grant receipts
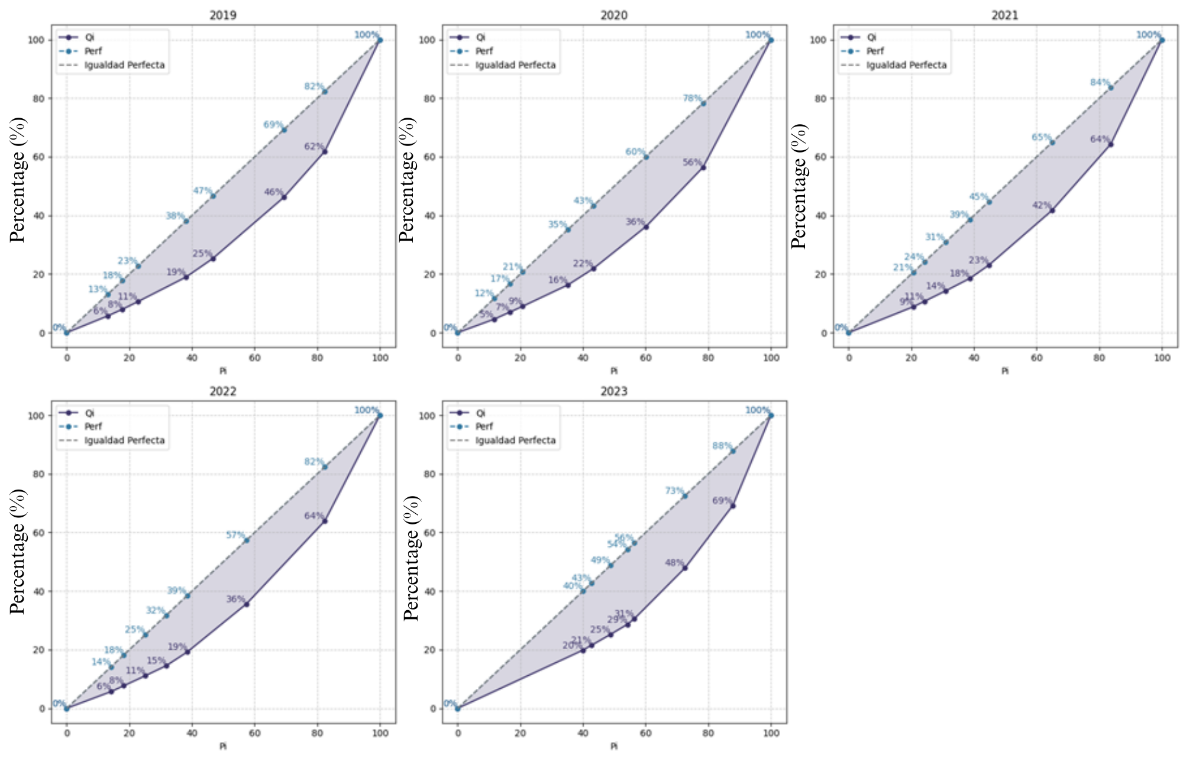
Source: Authors' elaboration with data from CHIP (2024) and DANE (2018a).
The equimarginality data strengthen this trend, as they show a considerable distance from the ideal distribution. This behavior coincides with what Dahlby and Wilson (1994) propose, who warn that differences in fiscal capacity between territories generate distortions that affect both economic efficiency and interjurisdictional equity.
On the other hand, when analyzing the density of tax revenues per capita in the study period, as illustrated in Figure 10, it can be argued that, in Aguachica, tax revenues per person remain quite stable over time, since they are concentrated in a specific range and with little variation. On the other hand, the department of Cesar has a bimodal density, and municipalities such as Chiriguaná, San Alberto, La Jagua de Ibirico and El Paso show greater volatility in their collection capacity, which indicates that their revenues may fluctuate more. For their part, municipalities such as Becerril and San Martín have a more dispersed distribution, with tax revenues that are distributed over a wide range and with several peaks at different levels.
Figure 10
Historical Comparison of Tax Revenue Density Per Capita
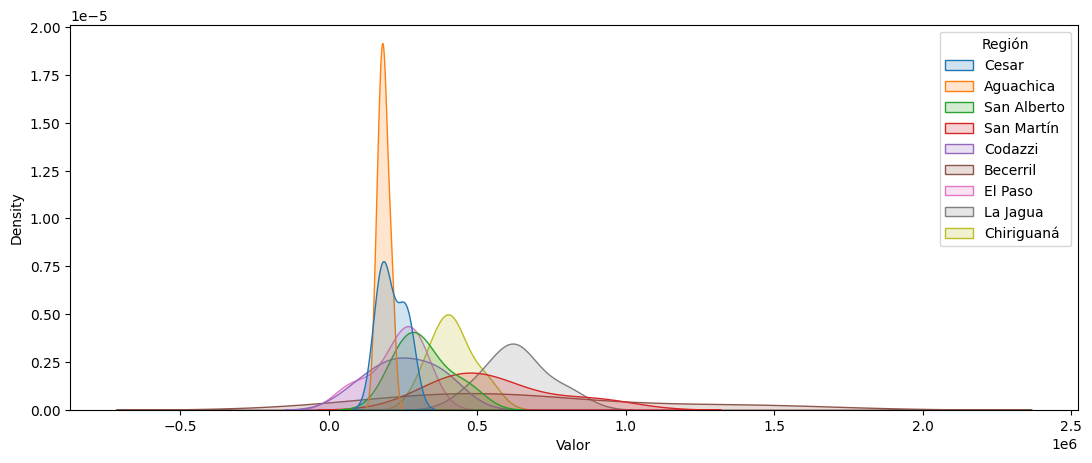
Source: Authors' elaboration with data from CHIP (2024) and DANE (2018a).
In terms of correlation of tax revenues and royalties, a more pronounced relationship with royalties is observed in municipalities such as Becerril, San Martín and San Alberto. On the contrary, Chiriguaná shows an inverse relationship; in addition, in terms of total income, municipalities such as El Paso, San Alberto and Aguachica, present correlations below 90%.
Table 3
Correlation of royalty income with respect to total revenue and tax revenue
Region |
Tax |
Total |
Cesar |
66,6% |
98,4% |
Aguachica |
56,7% |
71,5% |
Chiriguaná |
-34,8% |
98,7% |
El Paso |
23,5% |
38,9% |
Becerril |
92,4% |
99,9% |
San Martin |
82,4% |
97,1% |
Agustín Codazzi |
90,4% |
97,2% |
San Alberto |
89,8% |
87,1% |
La Jagua de Ibirico |
62,7% |
94,0% |
Source: Own elaboration with data from CHIP (2024).
When analyzing the values of per capita income in Table 4, it is observed that the municipality with the highest historical tax revenue per capita is Becerril, with 657,622. The second municipality is La Jagua de Ibirico, with an average value of 633,519. In third place is San Martín, with a value of 561,501. The department of Cesar and the municipality of Aguachica are surprising, with respective values of 212,830 and 184,211, the latter two being the regions with the largest population and with the lowest per capita fiscal indicator.
Table 4
Historical Comparison of Tax Revenue Per Capita
| Region |
Concept |
2019 |
2020 |
2021 |
2022 |
2023 |
Middle |
|---|---|---|---|---|---|---|---|
Cesar |
Tax |
225.567.556.781 |
224.605.348.733 |
251.912.632.855 |
348.151.131.049 |
358.185.808.970 |
212.830 |
Population |
1.247.975 |
1.290.219 |
1.322.378 |
1.349.162 |
1.373.581 |
||
Per-capita |
180.747 |
174.083 |
190.500 |
258.050 |
260.768 |
||
La Jagua de Ibirico |
Tax |
38.585.666.123 |
24.914.704.832 |
32.321.348.711 |
32.857.062.960 |
33.649.861.772 |
633.519 |
Population |
48.620 |
50.338 |
51.603 |
52.623 |
53.557 |
||
Per-capita |
793.617 |
494.948 |
626.346 |
624.386 |
628.300 |
||
El Paso |
Tax |
11.345.904.205 |
10.878.121.709 |
8.442.963.943 |
12.083.183.485 |
3.655.281.042 |
227.076 |
Population |
39.039 |
40.398 |
41.378 |
42.198 |
42.960 |
||
Per-capita |
290.630 |
269.274 |
204.045 |
286.345 |
85.086 |
||
San Martin |
Tax |
14.052.491.505 |
12.250.943.374 |
11.562.533.376 |
17.824.427.898 |
27.140.875.787 |
561.501 |
Population |
27.746 |
28.718 |
29.439 |
30.031 |
30.559 |
||
Per-capita |
506.469 |
426.595 |
392.762 |
593.534 |
888.147 |
||
San Alberto |
Tax |
8.155.843.862 |
6.446.087.656 |
7.688.279.783 |
10.170.563.458 |
13.851.311.109 |
318.896 |
Population |
27.319 |
28.280 |
29.008 |
29.611 |
30.145 |
||
Per-capita |
298.541 |
227.938 |
265.040 |
343.472 |
459.490 |
||
Becerril |
Tax |
14.388.648.345 |
5.908.794.727 |
8.663.707.014 |
15.456.303.863 |
34.625.911.581 |
657.662 |
Population |
22.485 |
23.265 |
23.847 |
24.351 |
24.797 |
||
Per-capita |
639.922 |
253.978 |
363.304 |
634.730 |
1.396.375 |
||
Chiriguaná |
Tax |
12.269.575.317 |
9.751.082.125 |
16.042.518.607 |
12.095.109.105 |
13.144.198.901 |
415.920 |
Population |
28.815 |
29.804 |
30.552 |
31.188 |
31.771 |
||
Per-capita |
425.805 |
327.174 |
525.089 |
387.813 |
413.717 |
||
Agustín Codazzi |
Tax |
6.399.298.709 |
13.885.218.771 |
15.603.844.073 |
23.453.247.559 |
27.446.552.996 |
256.408 |
Population |
63.205 |
65.428 |
67.084 |
68.472 |
69.759 |
||
Per-capita |
101.247 |
212.221 |
232.602 |
342.523 |
393.448 |
||
Aguachica |
Tax |
18.466.308.865 |
20.934.316.005 |
22.091.502.812 |
23.631.062.445 |
26.583.071.256 |
184.211 |
Population |
114.194 |
118.392 |
121.581 |
124.064 |
126.377 |
||
Per-capita |
161.710 |
176.822 |
181.702 |
190.475 |
210.347 |
Source: Authors' elaboration with data from CHIP (2024) and DANE (2018a).
Likewise, when comparing tax revenues per capita and the average population, as shown in Figure 11, municipalities such as Becerril and La Jagua de Ibirico are entities with high per capita tax revenues compared to their average population, which implies, in this context, the presence of significant natural resources.
On the other hand, San Alberto and Agustín Codazzi show more moderate incomes, despite having a similar population. On the other hand, municipalities with high populations, such as Aguachica and the department of Cesar, do not necessarily exhibit the highest incomes.
Figure 11
Historical comparison of tax revenues per capita and average population
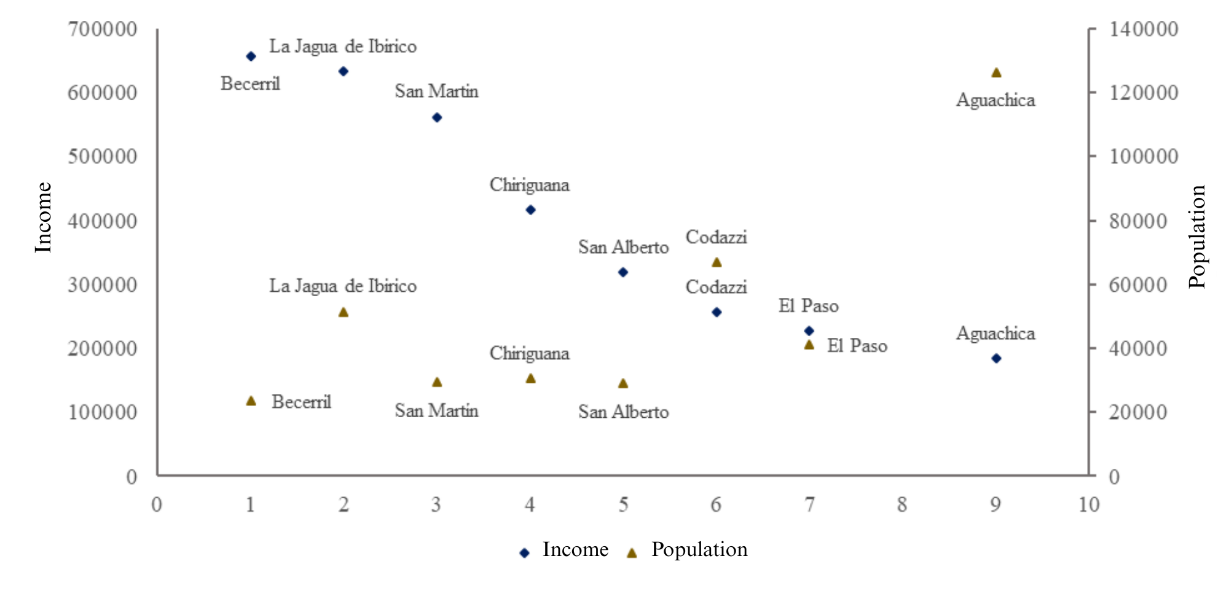
Source: Authors' elaboration with data from CHIP (2024) and DANE (2018a).
Returning to the Gini index, but for tax revenues, in 2019, inequality in tax revenues was 34.95%, as illustrated in Figure 12. In 2020, inequality increased considerably to 39.01%. In 2021 and 2022, inequality stabilized at around 38%. However, in 2023, it increased again to 39.44%, showing the growing trend of inequality in the distribution of tax revenues.
Figure 12
Gini index of tax revenue revenues in municipalities
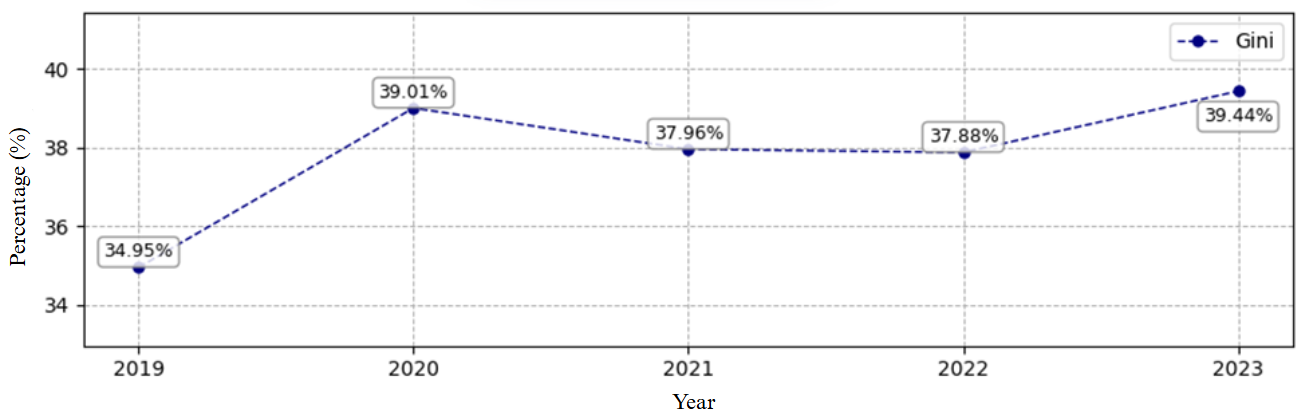
Source: Authors' elaboration with data from CHIP (2024) and DANE (2018a).
In relation to public social expenditure per capita, shown in Table 5, the municipality with the highest expenditure is Becerril, with an annual average of 1,763,357 pesos. It is followed by San Martín, with a difference of 199,219 pesos less, and in third place is Agustín Codazzi.
On the other hand, municipalities such as Aguachica and the department of Cesar, being among the regions with the largest population, have the lowest average values in terms of public social expenditure per capita.
Table 5
Public social expenditure per capita
Region |
2019 |
2020 |
2021 |
2022 |
2023 |
Cesar |
583.461 |
448.669 |
493.939 |
550.162 |
559.074 |
Aguachica |
659.424 |
700.642 |
697.974 |
794.568 |
960.258 |
Chiriguaná |
1.415.113 |
1.296.139 |
1.132.011 |
1.181.993 |
1.310.006 |
El Paso |
832.155 |
794.901 |
744.138 |
908.015 |
459.602 |
Becerril |
867.771 |
1.151.870 |
1.869.138 |
1.754.770 |
3.173.235 |
San Martin |
1.198.356 |
671.276 |
1.095.091 |
1.709.079 |
3.146.889 |
Agustín Codazzi |
185.321 |
1.174.966 |
1.744.642 |
1.833.717 |
1.805.477 |
San Alberto |
734.247 |
636.992 |
676.599 |
824.020 |
1.032.159 |
La Jagua de Ibirico |
1.150.634 |
910.662 |
1.213.252 |
1.719.383 |
1.574.211 |
Source: Authors' elaboration with data from CHIP (2024) and DANE (2018a).
Table 6 presents a paradox: if we assume a constant level of UBN during the five years analyzed, some regions with high public social expenditure per capita continue to register high levels of UBN, while others with less investment have lower figures; for example, Becerril reports the highest expenditure in 2023; however, it also has the highest index of UBN. In contrast, San Alberto shows the lowest budget allocation, but, at the same time, the lowest value of UBN.
Table 6
Percentage of total people in UBN
Municipality |
UBN |
Becerril |
35,52% |
Agustín Codazzi |
28,66% |
Chiriguaná |
25,45% |
SanMartin |
24,09% |
El Paso |
22,78% |
La Jagua de Ibirico |
21,27% |
Aguachica |
18,79% |
San Alberto |
13,73% |
Source: Taken from DANE (2018b).
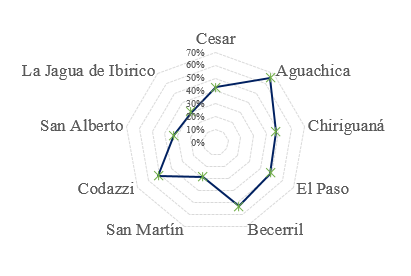
On the other hand, in relation to the share of administrative expenses over own income, as shown in Figure 13, the municipality of Aguachica has a higher proportion of its own income destined to cover administrative expenses, with a participation that exceeds 60%. The municipality that follows is Becerril, with a value of 53%, and then Agustín Codazzi, with 52%.
There are municipalities in which this participation has been increasing, which could be due to the decrease in their own revenues, as is the case of the municipality of El Paso. In contrast, in municipalities such as Agustín Codazzi and Becerril, participation has decreased as a result of the increase in their own income.
Figure 13
Share of administrative expenses in own income – historical average
Source: Own elaboration with data from CHIP (2024).
Figure 14 shows the relationship between public social expenditure per capita and tax revenues per capita in various regions. At first glance, a clear trend can be observed: regions that increase their public social spending tend to experience an increase in their tax revenues. This phenomenon can be explained by several factors. Greater investment in public social spending improves the quality of life of citizens, which translates into greater productivity and consumption, and, therefore, an increase in tax revenues.
Figure 14
Historical revenue from fiscal means per capita and average public expenditure per capita
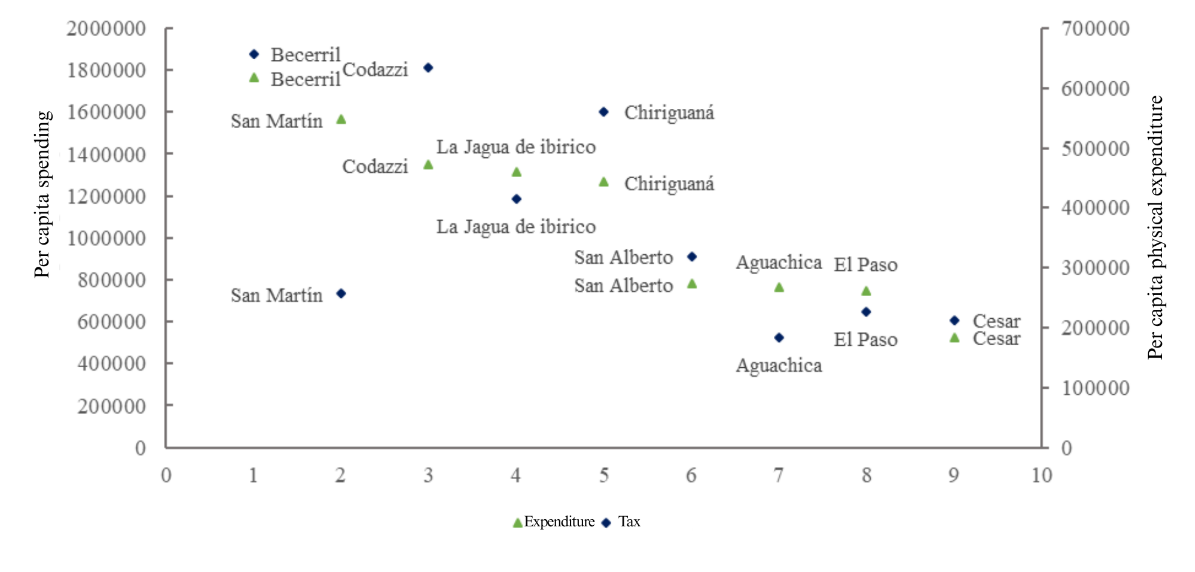
Source: Authors' elaboration with data from CHIP (2024) and DANE (2018a).
Table 7 shows the proportion of tax revenues in relation to public social expenditure during the period analyzed. Some municipalities, such as Aguachica and San Alberto, have maintained a stable and high relationship between tax revenues and social spending. In particular, Aguachica peaked at 64.1% in 2022, implying that the municipality has a remarkable capacity to finance about half of its public social spending with its tax revenues. This contrasts with municipalities such as Becerril and Agustín Codazzi. Becerril, for example, saw a reduction in its share from 73.7% in 2019 to a low of 19.4% in 2021, although it recovered slightly in the following years.
Table 7
Share of tax revenues as a proportion of public social expenditure
| Region |
2019 |
2020 |
2021 |
2022 |
2023 |
|---|---|---|---|---|---|
Cesar |
31,0% |
38,8% |
38,6% |
46,9% |
46,6% |
Aguachica |
45,3% |
54,2% |
63,9% |
64,1% |
63,9% |
Chiriguaná |
30,1% |
25,2% |
46,4% |
32,8% |
31,6% |
El Paso |
34,9% |
33,9% |
27,4% |
31,5% |
18,5% |
Becerril |
73,7% |
22,0% |
19,4% |
36,2% |
44,0% |
San Martin |
42,3% |
63,5% |
35,9% |
34,7% |
28,2% |
Agustín Codazzi |
54,6% |
18,1% |
13,3% |
18,7% |
21,8% |
San Alberto |
40,7% |
35,8% |
39,2% |
41,7% |
44,5% |
La Jagua de Ibirico |
69,0% |
54,4% |
51,6% |
36,3% |
39,9% |
Source: Own elaboration with data from CHIP (2024).
Figure 15 shows the trend over time in compliance with the legal limit of 80% in operating expenses, established by Law 617 of 2000. In this context, those lines that exceed this threshold indicate non-compliance with the rule by the territorial entities in the respective fiscal periods.
Figure 15
Compliance with the limits of the operating expenditure of the territorial entities
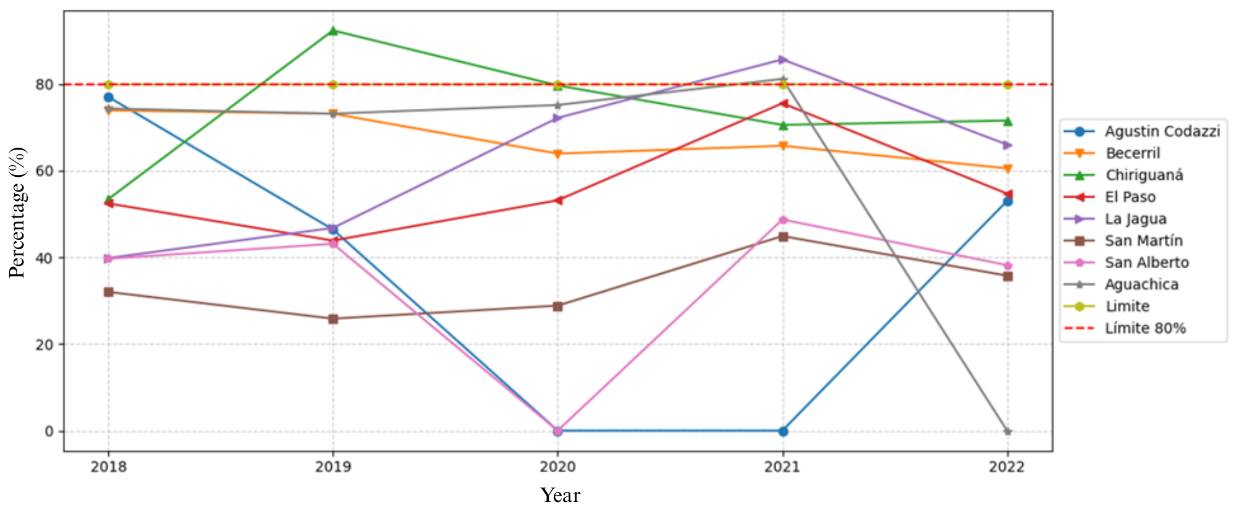
Source: Own elaboration with data from the Office of the Contraloría General de la Nación (2024).
In relation to Table 8 and Figure 15, the Office of the Contraloría General de la Nación (2024) refers to Law 617, which establishes provisions for the rationalization of public spending and the fiscal consolidation of territorial entities; in this case, during each fiscal period, operating expenses may not exceed, as a proportion of their Free Destination Current Income (ICLD), 80% for municipalities in the fourth, fifth and sixth categories.
Table 8
Compliance with operating expense limits
| Municipalities |
2018 |
2019 |
2020 |
2021 |
2022 |
2023 |
|---|---|---|---|---|---|---|
Agustín Codazzi |
77% |
46,4% |
0% |
0% |
52,9% |
39,5% |
Becerril |
73,8% |
73,1% |
63,9% |
65,7% |
60,5% |
67,0% |
Chiriguaná |
53,4% |
92,3% |
79,6% |
70,5% |
71,5% |
59,9% |
El Paso |
52,4% |
43,8% |
53,1% |
75,5% |
54,6% |
54,6% |
San Martin |
32,0% |
25,8% |
28,8% |
44,8% |
35,7% |
40,5% |
San Alberto |
39,6% |
43,1% |
0% |
48,7% |
38,1% |
36,0% |
Aguachica |
74,3% |
73,1% |
75,1% |
81,1% |
0% |
60,6% |
La Jagua de Ibirico |
39,8% |
46,7% |
72,1% |
85,6% |
65,9% |
36,4% |
Source: Own elaboration with data from the Office of the Contraloría General de la Nación (2024).
Discussion
The findings of this study confirm the persistence of horizontal fiscal inequalities among the municipalities of the department of Cesar, a phenomenon widely discussed in the literature. As Martinez and Searle (2007) argue, these inequalities arise from the discrepancy between the collection capacity and the spending needs of each jurisdiction. Indeed, the results show that municipalities with larger populations or poverty levels do not necessarily have a greater fiscal capacity, which suggests a dysfunctional allocation of resources in the face of territorial needs.
In line with the analyses of Bonet (2004) and Romero and Delgado (2021), the evidence shows that, after decades of fiscal decentralization, regional disparities in revenues and fiscal capacities not only persist, but in some cases have intensified. This situation is aggravated in municipalities whose economy is limited to primary activities with low added value, reflecting Bonet's (2005) warning about the weak productive links in sectors such as mining. Municipalities such as La Jagua de Ibirico and Becerril, which receive significant income from royalties, do not necessarily have better indicators of fiscal sustainability or economic development, which reinforces the idea that dependence on non-renewable resources can generate a mirage of development.
The results also corroborate the mitigating role of certain transfer systems, such as the GSP, in reducing fiscal disparities, especially in smaller municipalities. This finding is in line with the conclusions of Bonet and Ayala (2015), who identify a more significant impact of the SGP in municipalities than in departments. However, it was identified that SGR tends to concentrate resources in municipalities with extractive activity, which widens the gaps with those territories that lack these resources, in line with the observations of Bonet and Meisel (2007).
A particularly relevant aspect is the evolution of the share of royalties within the income of the department of Cesar. As Bonet (2007) pointed out, this source represented about 25% of departmental revenues in 2005. By 2023, this value rose to 46.7%, confirming the growing dependence on non-renewable resources. This behavior poses serious challenges for financial sustainability, especially considering the World Bank's (2013) warning that the most efficient public spending is that which focuses on productive infrastructure and not only on current spending.
Finally, although national transfers have had a softening effect on fiscal inequalities, structural weakness persists in the generation of own income by most municipalities in the department of Cesar. This situation supports the recommendations of Bonet (2007) on the need to strengthen local taxation mechanisms, diversify territorial economies and improve institutional capacity for efficient resource management.
Conclusions
This study showed that the population dimension does not guarantee a greater generation of own tax revenues. Municipalities such as Becerril and La Jagua de Ibirico, despite their smaller population size, stand out for their high income derived from the exploitation of natural resources, accompanied by a marked dependence on royalties. This result exposes the structural vulnerability of several municipalities in the department of Cesar to the volatility of these resources.
There was also a significant inequality in the distribution of tax revenues and transfers, expressed through the Gini indices, which remained between 34% and 41%. The correlation between royalties, tax revenues and public social expenditure varies between municipalities, highlighting cases such as Aguachica and San Alberto, which showed stability in their ability to finance social spending with their own revenues, unlike Becerril and Agustín Codazzi, where significant fluctuations were observed.
These results are relevant in the department of Cesar, characterized by its high dependence on extractive resources and its unequal fiscal structure. In this sense, the research contributes to the academic debate on fiscal equity and spending efficiency in decentralization scenarios, by showing how the concentration of royalties can distort the management capacity of territorial entities and perpetuate structural inequalities.
Among the limitations of the study are the use of data in nominal values without adjustment for inflation, the dependence on population projections based on the 2018 census, and the absence of broader socioeconomic control variables (such as education or health indicators).
As lines of future research, it is urged to deepen the analysis of the efficiency of public spending through techniques such as Data Envelopment Analysis (DEA), incorporate deflators to compare in real terms and explore the relationship between the fiscal structure and performance in human development indicators at the municipal level.
Ethical considerations
The present research did not require ethical endorsement because it was based on governmental documents.
Source of financing
The project is not subject to financing from any public or private entity.
References
(30)World Bank's. (2013). Hacia un gasto público social más eficiente y efectivo en Centroamérica. https://www.bancomundial.org/es/region/lac/publication/toward-more-efficient-and-effective-public-social-spending-in-central-america
Annexes
Annex 1
Income and expenditure by all municipalities
Concept |
2019 |
2020 |
2021 |
2022 |
2023 |
Total Revenue |
663.712.148.236 |
544.033.409.175 |
794.053.933.178 |
793.477.890.788 |
1.351.817.884.263 |
Tax revenues |
123.663.736.931 |
104.969.269.199 |
122.416.698.319 |
147.570.960.773 |
180.097.064.444 |
Transfer Income |
484.625.326.328 |
397.943.840.370 |
597.615.169.545 |
590.838.165.922 |
1.094.525.945.231 |
Own income |
173.938.464.705 |
138.760.562.660 |
186.643.846.139 |
197.426.917.501 |
258.828.197.994 |
Administration Fees |
65.399.670.807 |
58.714.545.649 |
63.681.586.253 |
76.621.263.324 |
79.374.036.246 |
Total expenses |
417.031.488.831 |
516.871.002.158 |
617.000.700.741 |
677.883.249.029 |
733.476.003.168 |
Public social expenditure |
289.042.597.593 |
340.499.583.358 |
426.319.988.841 |
508.250.841.924 |
598.944.427.438 |
Source: Own elaboration with data from CHIP (2024).
Annex 2
Value added by type of activity
Year |
Activity |
Aguachica |
Chiriguaná |
El Paso |
Becerril |
San Martin |
Agustín Codazzi |
San Alberto |
La Jagua de Ibirico |
Total |
2019 |
75 |
46 |
243 |
2338 |
530 |
1012 |
100 |
1662 |
6006 |
|
165 |
16 |
19 |
15 |
21 |
55 |
137 |
108 |
537 |
||
613 |
153 |
213 |
120 |
164 |
347 |
188 |
219 |
2017 |
||
Primary |
86 |
69 |
597 |
2193 |
930 |
1592 |
93 |
3212 |
8773 |
|
Secondary |
165 |
20 |
23 |
17 |
24 |
58 |
149 |
112 |
568 |
|
Tertiary |
637 |
158 |
236 |
128 |
165 |
347 |
197 |
230 |
2099 |
|
2021 |
Primary |
119 |
69 |
366 |
5338 |
974 |
272 |
152 |
2237 |
9526 |
Secondary |
215 |
20 |
22 |
17 |
24 |
73 |
182 |
151 |
704 |
|
Tertiary |
735 |
177 |
250 |
136 |
186 |
401 |
221 |
258 |
2364 |
|
2022 |
Primary |
166 |
346 |
1703 |
13028 |
1587 |
264 |
229 |
4446 |
21769 |
Secondary |
272 |
27 |
29 |
23 |
32 |
94 |
227 |
187 |
891 |
|
Tertiary |
857 |
193 |
294 |
163 |
210 |
467 |
256 |
297 |
2737 |
Source: Authors' elaboration with data from DANE (2022).
Annex 3
Transfers and subsidies accumulated by municipalities
Concept |
General System of |
General System of |
General System of |
Other Transfers |
Aguachica |
247.107.599.517 |
28.367.562.134 |
229.692.272.628 |
22.231.206.471 |
Chiriguana |
84.477.051.818 |
130.706.645.948 |
62.374.747.817 |
11.214.456.277 |
El Paso |
87.965.393.784 |
32.877.997.096 |
53.090.423.207 |
8.120.642.026 |
Becerril |
79.547.478.099 |
628.323.639.295 |
43.275.740.229 |
29.996.456.269 |
San Martin |
66.220.406.345 |
79.507.510.411 |
42.978.343.064 |
4.904.618.386 |
Agustín Codazzi |
155.226.329.050 |
237.727.485.696 |
137.711.401.015 |
54.159.304.574 |
San Alberto |
61.018.765.539 |
13.341.175.163 |
41.762.799.211 |
5.436.239.894 |
La Jagua de Ibirico |
100.420.098.046 |
346.290.700.184 |
68.521.009.035 |
92.511.928.974 |
Source: Own elaboration with data from CHIP (2024).
It includes electricity, gas and water activities; commerce; repair of motor vehicles; transport; accommodation and food services; information and communications; financial and insurance activities; real estate activities; professional, scientific and technical activities; administrative and support services activities; public administration; education; bless you; artistic, entertainment and recreation activities; activities of individual households.