Timelines associated with the neonatal jaundice care cycle and assessment of caregiver satisfaction

Timelines associated with the neonatal jaundice care cycle and assessment of caregiver satisfaction

Tiempos asociados al ciclo de atención de Ictericia neonatal y evaluación de la satisfacción del cuidador

Tempos associados ao ciclo de cuidados da icterícia neonatal e avaliação da satisfação do cuidador

Citation: Noguera LE, Camacho-Cruz J, Vásquez-Hoyos P, Suarez-Cuellar CC, Morales-Lombo AM, Rivera LM, et al. Timelines associated with the neonatal jaundice care cycle and assessment of caregiver satisfaction. Univ Salud [Internet]. 2025; 27(2):e8601. DOI: https://doi.org/10.22267/rus.252702.345.


# Abstract

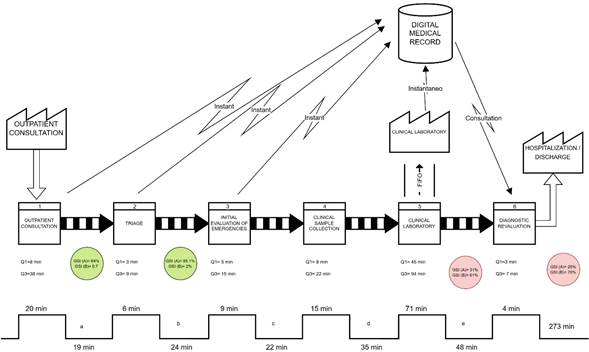
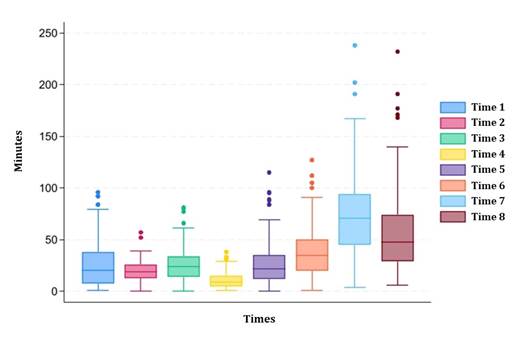
Introduction: Neonatal hyperbilirubinemia is a major health problem, a common cause of morbidity. Worldwide, it affects up to 60% of term newborns. Its diagnosis is by means of serum bilirubin levels, which is associated with certain disadvantages, especially in terms of discomfort related to delayed results. Objective: To evaluate the relationship between caregiver satisfaction and the time associated with the cycle of care for the diagnosis of neonatal jaundice. Materials and methods: Cross-sectional observational study, neonates with clinical evidence of jaundice were included. Demographic data were collected, a satisfaction survey was applied to evaluate the level of caregiver satisfaction, and the times associated with the cycle of care from the moment of admission to the medical procedure were recorded. Results: A patient flow analysis was performed, and it was found that waiting time is significant, especially in obtaining laboratory results. Caregivers' satisfaction with waiting times influences their overall perception of service quality. Conclusions: The potential implementation of new diagnostic instruments could generate added value to the service by speeding up medical decision making.

Keywords: Neonatal jaundice; pediatrics; bilirubin; time. (Source: DeCS, Bireme).

Sustainable development goals: Good health and well-being. (Source: SDG, WHO).


# Resumen

Introducción: La hiperbilirrubinemia neonatal es un problema de salud importante, una causa común de morbilidad. Mundialmente, afecta hasta el 60 % de los recién nacidos a término. Su diagnóstico es clínico y se confirma por medio de la toma de bilirrubinas séricas, que se asocia con ciertas desventajas, especialmente molestias relacionadas con la demora en los resultados. Objetivo: Evaluar la relación entre la satisfacción de los cuidadores y los tiempos asociados al ciclo de atención para el diagnóstico de ictericia neonatal. Materiales y métodos: Estudio observacional transversal, se incluyeron neonatos con evidencia clínica de ictericia. Se recolectaron datos demográficos, se aplicó una encuesta de satisfacción para evaluar el nivel de satisfacción de cuidadores, se registraron los tiempos asociados al ciclo de atención desde el momento de ingreso hasta la toma de la conducta médica. Resultados: Se realizó un análisis del flujo de pacientes y se encontró que el tiempo de espera es significativo, especialmente en la obtención de resultados de laboratorio. La satisfacción de los cuidadores con respecto a los tiempos de espera influye en su percepción general de la calidad del servicio. Conclusión: La implementación potencial de nuevos instrumentos diagnósticos podría generar un valor agregado al servicio, acelerando la toma de decisiones médicas.

Palabras clave: Ictericia neonatal; pediatría; bilirrubina; tiempo. (Fuente: DeCS, Bireme).

Objetivos de desarrollo sostenible: Salud y bienestar. (Fuente: ODS, OMS).


# Resumo

Introdução: A hiperbilirrubinemia neonatal é um grande problema de saúde, uma causa comum de morbidade. Em todo o mundo, afeta até 60% dos recém-nascidos a termo. Seu diagnóstico é feito através da dosagem da bilirrubina sérica, o que traz algumas desvantagens, principalmente o desconforto relacionado à demora na obtenção dos resultados. Objetivo: Avaliar a relação entre a satisfação do cuidador e o tempo associado ao ciclo de cuidados para o diagnóstico de icterícia neonatal. Materiais e métodos: Estudo observacional transversal, foram incluídos neonatos com evidência clínica de icterícia. Dados demográficos foram coletados, uma pesquisa de satisfação foi aplicada para avaliar a satisfação do cuidador e o tempo associado ao ciclo de cuidados foi registrado desde o momento da admissão até o início do tratamento médico. Resultados: Foi realizada uma análise do fluxo de pacientes e constatou-se que o tempo de espera é significativo, principalmente para obtenção de resultados laboratoriais. A satisfação dos cuidadores com os tempos de espera influencia sua percepção geral da qualidade do serviço. Conclusão: A potencial implementação de novos instrumentos diagnósticos poderá gerar valor agregado ao serviço, agilizando a tomada de decisão médica.

Palavras-chave: Icterícia neonatal; pediatria; bilirrubina; tempo. (Fonte: DeCS, Bireme).

Metas de Desenvolvimento Sustentável: Saúde e bem-estar. (Fonte: ODS, OMS).


# Introduction

Hyperbilirubinemia during the neonatal period is an important health problem. This is biochemically characterized by an increase in total serum bilirubin (TSB) and represents a risk for mainly the central nervous system where it can accumulate and generate serious sequelae1. Neonatal jaundice is a common cause of morbidity. It affects about 60% of full-term newborns and 80% of premature newborns worldwide and is considered the seventh leading cause of neonatal death2. In Latin America, the prevalence of jaundice in countries such as Chile and Bolivia is 69% and 76%, respectively while in Colombia it is 60% and represents up to 20% of admissions to the neonatal intensive care unit (NICU)3. In a high complexity hospital institution in the city of Bogotá, Colombia, neonatal jaundice was the eighth cause of admission to the pediatric emergency department in 2018 (3% of the total population treated) and the first cause of admission to the NICU where it accounted for 25% of occupancy4.

The initial diagnostic approach is subjectively done using the Kramer scale. This scale is used by an observer to identify the yellowish color of the skin caused by an elevated bilirubin level, which must later be confirmed objectively by measuring the BST5. Failure to measure it carries a high risk of bilirubin-induced neurological dysfunction and irreversible neurological damage, especially with values above 20 mg/dl6.

Three methods can be used to measure bilirubin levels. These are spectrophotometry, transcutaneous bilirubinometer (TCB), or BST measurement, which is considered the gold standard because it has a sensitivity of about 90% in the diagnosis of hyperbilirubinemia2,7. However, BST measurement is associated with certain disadvantages since it is done by venipuncture. These include pain, bleeding, infection or the need for several subsequent punctures8. In addition to this, taking the sample and laboratory processing is related to prolonged waiting for results and, therefore, delays in both care and overcrowding in the emergency room. This, in turn, can lead to increased discomfort and great distress on the part of the caregiver. Therefore, some institutions have opted for the use of TCB which makes it possible to quantify BST in a non-invasive manner and correlates significantly with serum tests. It is also an easy method to use in outpatient settings and provides an immediate result, represents a lower cost for the health system, and generates significant reductions in waiting times while improving caregiver satisfaction9,10.

This study seeks to evaluate the relationship between caregiver satisfaction and the times associated with the cycle of care for the diagnosis of neonatal jaundice under the current protocol with BST as implemented in the pediatric unit of a high complexity institution and to identify the stages of the service that could be improved in order to provide better care.


# Materials y methods

A cross-sectional observational study was done in which neonates (0 days to 1 month) that were admitted to the emergency department and pediatric outpatient clinic with clinical evidence of jaundice were included. Patients hospitalized since birth and a history of metabolic or genetic disorders were excluded. The time frame of the study was from July to October 2020. A non-probabilistic convenience sampling method11 was used to select the participants thus allowing data to be collected from patients who met the established criteria based on their arrival at the facility. Demographic data such as gestational age, sex, current weight, race, type of diet and type of delivery were collected from medical records6. A Likert-type satisfaction survey was used to assess the level of satisfaction of caregivers with care received during the waiting period. The times associated with the cycle of care from the moment of admission to the taking of medical action were recorded. The measurement methods involved tracking the time allotted for each phase of care. A collection instrument was used to collect the data which were then transferred to an Excel spreadsheet for analysis. Prior to validating the data quality, patients whose data was missing were excluded, specifically in those cases where 10% or more of the information was missing from their records.

A descriptive analysis of the sociodemographic characteristics of the population was done using the STATA18 statistical package. Qualitative variables are presented as absolute frequencies and percentages while quantitative variables are presented as medians and interquartile ranges given their distribution.


# Results

In the analysis of the periods of time associated with the care cycle, a quantile regression model was used for 50% (median). This made it possible to estimate the median differences in service times for each stage of the process in order to identify possible delays and areas for improvement. The clinical laboratory sample processing time was selected as the benchmark category against which the other stages were contrasted. The coefficients obtained through the model represent the amount of time that each stage differs from the benchmark stage and allow a direct interpretation of the delays or advances in minutes. To ensure the robustness of the analysis, 95% confidence intervals were calculated, and the statistical significance of differences was verified with p values.

Participants signed a consent form for processing the anonymously collected data, and the study was approved by the institution's research ethics committee. In addition, informed consent was obtained from the parents or guardians for the handling of personal data during the study.

# Demographic characteristics

A total sample of 148 admissions was obtained of which 100 (68%) corresponded to outpatient admissions and 47 (32%) to emergency consultations. There were 78 (53%) male newborns with a median gestational age of 39 weeks (interquartile range [IQR] 38-39). Of these, 5 (4%) were premature, born at 36 weeks. All of the newborns were of Latino origin. As for the type of nutrition, they were divided into three categories: 126 (86%) breastfeeding, 1 (0%) breast milk substitute, and 20 (14%) mixed feeding. The triggering causes of jaundice were blood group incompatibility for 41 (28%) patients, Rh incompatibility for 8 (5%), low weight at birth for 5 (3%) patients, and neonatal sepsis for 2 (1%) patients. Eleven (7%) patients had a history of a sibling with jaundice requiring hospitalization. Other associated factors, such as cephalohematoma, were found in 5 (3%) patients. The demographic characteristics of patients are presented in Table 1.

# Table 1. Clinical and demographic characteristics
Variable N= 147
Gender, n (%)
Male 78 (53)
Female 69 (47)
Current weight (g), median (IQR) 2,89 (2,62-3,23)
Gestational age (weeks), median (IQR) 39 (38-39)
Race, (%) Latinos 147 (100)
Type of feeding, n (%)
Breastfeeding 126 (86)
Formula feeding 1 (0)
Mixed feeding 20 (14)
Type of delivery, n (%)
Cesarean section 46 (31)
Vaginal delivery 101 (69)
Blood group incompatibility, n (%)
Yes 41, (28)
No 106, (72)
Rh incompatibility, n (%)
Yes 8, (5)
No 139 (95)
Low birth weight, n (%)
Yes 5 (3)
No 142 (97)
Sepsis, n (%)
Yes 2 (1)
No 145 (99)
Percentage of weight loss, median (IQR) 4,5 (1,1-7,1)
History of sibling with jaundice, n (%)
Yes 11 (7%)
No 116 (91%)
No data 20 (14%)
Cephalohematoma, n (%)
Yes 5 (3)
No 94 (94)
No data 8 (5)

The table presents the clinical and demographic characteristics found in the study population.

# Patient flow analysis

The study of patient flow in the neonatal department, often accompanied by the postpartum mother, outlined nine key stages from arrival at the facility to completion of the cycle of care. These stages range from admission to the neonatal unit to referral to the emergency department for suspected jaundice, waiting for emergency triage, initial emergency assessment, blood sampling, sending the blood sample to the clinical laboratory, waiting for results, diagnostic re-evaluation, and finally, taking medical action after re-evaluation.

Using a Value Stream Mapping approach12-14, the maximum and minimum care cycle times and times were evaluated using the IQR range concept and satisfaction at some key stages as well as the service model and information flow as shown in Figure 1.

# Figura 1. Value stream map of the Paediatric Department
Figura 1
  1. GSI: General Satisfaction Index.
  2. GSI (A): Positive satisfaction.
  3. GSI (B): Negative satisfaction.
  4. Q1: Time of the first quartile (minimum).
  5. Q3: Time of the third quartile (maximum).
  6. An analysis of the value flow in the service is presented, where each stage of the care process is shown by a box, connected by thick arrows that indicate the direction of flow and the priority of patient care. The segmented arrows indicate the flow of information, while the circles represent the level of satisfaction of the caregivers during the process. The solid lines represent the average time at each stage and between them, considering the waiting time. The analysis focuses on the effective care time, considering the time between care as wasted, reflected in the satisfaction of the caregivers.

The synthesis of the times at each stage and totals as well as their maximum and minimum values are presented in Table 2. Figure 2 provides a visual illustration of waiting and consultation times in outpatient and emergency medical care.

# Figura 2. Analysis of waiting times and consultation times in medical care
Figura 2

The Figure shows the distribution of waiting and consultation times in an outpatient and emergency care setting. The data, represented by box-and-whisker plots, reveal the median, interquartile range, and minimum and maximum values for each variable, including outpatient consultation times, waiting times between stages of care, and sample processing times in the clinical laboratory.

Note that the waiting times between each of the six stages of the process total 148 minutes on average with a minimum of 88 and a maximum of 220 minutes. This is approximately 54.21% of the total time. Waiting time after the initial emergency consultation associated with the serum test corresponds to 105 minutes and is equivalent to 38.46% of the entire care cycle. The total time after the initial assessment consultation is 71.43% of the total time.

Table 2 shows the differences in median times for the nine stages of the care process using the clinical laboratory sample processing time as a benchmark. Each coefficient represents how much time, in minutes, the median of each stage increases or decreases compared to the benchmark time. The results indicate that, for example, the waiting time between outpatient consultation and triage (Moment 2) is on average 52 minutes less than the benchmark time with a 95% confidence interval of (-58.61, -45.39) and thus suggests efficiency in this phase.

# Table 2. Summary of service times in the observed period
Movement Name N° cases Median Intercuartile Range (IQR) Minimum Maximum Difference in median time (minutes) p-value 95% Confidence interval
1 Outpatient consultation time 100 20 31 1 79 -51 <0,001< /td> (-57,61, -44,39)
2 Waiting time between outpatient consultation and triage 100 19 20 0 52 -52 <0,001< /td> (-58,61, -45,39)
3 Waiting time between triage and emergency assessment 147 24 20 0 80 -47 <0,001< /td> (-52,95, -41,05)
4 Initial emergency assessment time 147 9 20 1 38 -62 <0,001< /td> (-67,95, -56,05)
5 Waiting time between initial emergency assessment and sample collection 147 22 26 0 96 -49 <0,001< /td> (-54,95, -43,05)
6 Time from sample collection to arrival at the clinical laboratory 147 35 30 1 127 -36 <0,001< /td> (-41,95, -30,05)
7 Clinical laboratory sample processing time 147 71 113 4 238
8 Waiting time between laboratory results and reassessment 147 48 45 6 232 -23 <0,001< /td> (-28,95, -17,05)
9 Time of reassessment consultation for diagnosis 147 4 6 1 38 -67 <0,001< /td> (-72,95, -61,05)

This table shows the results of a 50% (median) quantile regression model, which estimates the effect of the different moments in the care process on the duration of each stage, using the clinical laboratory processing time (Moment 7) as a benchmark. The coefficients reflect the variation with respect to this benchmark and are all statistically significant (p < 0.001).

# Satisfaction

A survey was done of 144 caregivers in order to assess their level of satisfaction with the care received. This questionnaire, which has been validated and is widely used in the institution for the development of quality indicators, consists of 7 questions related to the care process.

Of the total number of caregivers, 99 (69%) came from outpatient consultation and 45 (31%) came directly to the emergency department. Sixty-four percent agreed with the transfer times from the outpatient clinic to the emergency department while 0.7% disagreed. Regarding the time between triage and emergency evaluation, 95% agreed while 2% disagreed. Regarding transfers from initial medical evaluation to reevaluation, 31% agreed, while 61% disagreed to some degree. A similar result was noted in the question regarding the total length of stay with only 25% agreeing while 70% disagreed.


# Discussion

The present study showed an average duration of the care cycle of more than 4 hours. The longest waiting time was due to the processing of the sample and the BST result report in the reevaluation session, a problem that caused the caregiver a high level of dissatisfaction.

The value analysis clearly differentiates between the steps within a medical care pathway in which caregivers receive care while delays or waits are perceived as inefficiency in the service15. Rather than evaluating a health service as a manufacturing process, it makes it possible to pinpoint areas of dissatisfaction and promote improvements in healthcare by means of targeted actions16. Therefore, this methodology has recently been adopted in the area of medical research to evaluate the flow of activities in the clinical field and thus determine the costs and inefficiencies in health care processes in order to optimize them in not only economic and quality terms, but also terms of patient safety17.

When the time elapsed since the patient's admission to the institution is considered, it can be concluded that the procedure that determines the longest waiting time is the laboratory results report (serum bilirubin). This is still being used as a method of diagnosis and follow-up in the hospital and requires up to 4 hours to define the diagnosis or medical treatment for patients admitted for emergency care and up to 5 hours for those admitted for outpatient consultation.

Delays in laboratory results in emergency departments have significant financial implications since they generate additional costs such as prolonged patient stays, extra hours of medical care, and increased use of facilities and resources. In addition, they affect patient flow, thus reducing the center's capacity to handle new cases and, consequently, decreasing potential revenue18. Cost studies done with a North American population showed an overall reduction in laboratory expenses of approximately 75% with respect to the reduction in the number of samples taken, the time required by nurses, and a decrease of up to 70% in unnecessary sample collection19.

Likewise, the caregivers' perception of the waiting times in comparison to the actual waiting times is a determining factor in their satisfaction, i.e., a waiting time perceived as short or acceptable is positively associated with satisfaction20. However, studies focusing on cases of neonatal jaundice that correlate caregiver satisfaction with care times are lacking.

Although caregivers reported no complaints, there were at least 7 points when they had to move to a different area within the institution before finally receiving medical treatment. Sometimes they also had to return up to 3 times for readmission for BST monitoring. Therefore, the implementation of new technologies could prevent unnecessary admissions, allow for timely discharges for those who do not require hospital treatment, and thus improve the quality of care and satisfaction of users' expectations21.

Waiting time and the need for transfers within the institution are essential points in evaluating new diagnostic instruments due to the risks associated with visiting healthcare facilities even if they are outpatient ones. As mentioned in a publication of the American Academy of Pediatrics, the risk of contagion from airborne infections, measles, tuberculosis, hepatitis B and C, and other infectious diseases among companions, patients, and health care personnel after visiting health care facilities has been demonstrated22,23.

This enables us to appreciate the benefits that technological change could bring in terms of potential improvements in the efficiency of neonatal hyperbilirubinemia diagnosis in emergency departments through the possible introduction of TCB instead of the conventional serum method. Some healthcare centers have opted for the use of TCB, and this has resulted in a significant reduction in waiting times, from 4 hours to 1 on average as documented in a study done in the United Kingdom10. This finding is compatible with the one also reported in Malaysia of 1842 newborns in 2020. Transcutaneous bilirubin was measured in less than 5 min versus 1.5 hours for those neonates who were evaluated with serum bilirubin24.

The use of TCB has also demonstrated a 38.5% reduction in venipunctures with reliable measurements of bilirubin levels in recent premature newborns with a gestational age of 28 to 35 weeks25. A sensitivity and specificity of 91% and 90%, respectively, has also been reported for predicting the need for phototherapy, or 94% and 36% when used as a follow-up on a patient already hospitalized and under treatment26. Furthermore, it makes it possible to obtain synchronous quantitative data at the time of the visit that guides clinical decision making and reduces delays in clinical care for patients who do not require hospitalization27.

Although TCB has not yet been implemented, VSM analysis projects a significant reduction of 273 to 93 minutes on average in total cycle time for sampled patients. This potential change would represent a 65.59% reduction in time compared to the serum method. The projected reduction in diagnostic time to 81 minutes (29.67% of the current time) suggests not only improved efficiency, but also faster and more accurate patient care.


# Conclusions

The potential implementation of the transcutaneous bilirubinometer could add value to the service by speeding up medical decision making that could be crucial in cases of neonatal jaundice and other bilirubin-related conditions.

Although there are not many studies yet that analyze the time spent in pediatric emergency rooms, which makes comparisons difficult, it is to be hoped that the results of this study may be the basis for future studies that will enable the implementation of new technologies, procedures, and/or processes in the institutional protocol for the care of newborns who require testing for neonatal jaundice.

This study has some limitations. The first is that the use of a non-probabilistic convenience sampling method when a case of interest is presented may limit the overall applicability of the results. Likewise, the second limitation is reflected in the satisfaction survey that may be affected by subjective factors associated with caregiver stress. However, despite these limitations, we were able to capture 20% of the population that came to the pediatrics unit and 100% of the cases of interest to the study based on the protocol. Another limitation lies in its purely descriptive approach. This hindered our ability to do a more in-depth analysis that could reveal detailed causal or associative relationships between the variables studied. Although this is an opportunistic study, its objective is not to formalize the use of the transcutaneous bilirubinometer but to evaluate its efficacy.


# References

  1. Bhutani VK, Johnson LH. Jaundice and hyperbilirubinemia in the newborn. In: Kliegman R, St. Geme III JW eds. Nelson Textbook of Pediatrics [Internet]. 21st ed. Elsevier; 2019:858-869. Available from: https://shop.elsevier.com/books/nelson-textbook-of-pediatrics-2-volume-set/kliegman/978-0-323-52950-1
  2. Guamán-Noboa JM, Yauli-Flores CF. Neonatal hyperbilirubinemia and the role of the clinical laboratory in diagnosis. Med Lab [Internet]. 2023; 27(4):369-381. Available from: https://www.medigraphic.com/cgi-bin/new/resumenI.cgi?IDARTICULO=112881&idP=10455
  3. Martínez LI. Ictericia neonatal - hiperbilirrubinemia indirecta. Soc Colomb Pediatr [Internet]. 2011; 2:38-55. Available from: http://www.neopuertomontt.com/USS/Pasada_Neonatologia/Modulos_Neonatologia/Modulo_Gastroenterologia /Ictericia_neonatal.pdf
  4. Hospital de San José. Informe de la Oficina de Estadística y Epidemiología del Hospital de San José [Internet]. 2019. Available from: https://hospitaldesanjose.org.co/wp-content/uploads/2024/04/IG2023-SociedaddeCirugíadeBogotá_HospitaldeSanJosé%20%281%29.pdf
  5. Salazar-Porras D, Aguilar-Hernández LM, González-Alfaro FJ. Neonatal jaundice: frequent clinical manifestation in pediatrics. Rev Med Sinerg [Internet]. 2023; 8(8):e1085. DOI: 10.31434/rms.v8i8.1085
  6. Campbell-Wagemann S, Mena-Nannig P. Severe hyperbilirubinemia in newborns, risk factors and neurological outcomes. Rev Chil Pediatr [Internet]. 2019; 90(3):267-274. DOI: 10.32641/rchped.v90i3.772
  7. Hulzebos CV, Vitek L, Coda-Zabetta CD, Dvorák A, Schenk P, Van der Hagen EAE. et al. Diagnostic methods for neonatal hyperbilirubinemia: benefits, limitations, requirements, and novel developments. Pediatr Res [Internet]. 2021; 90(2):277-283. DOI: 10.1038/s41390-021-01546-y
  8. Perdomo-Rodríguez AP, Urriago-Campos PA, Castro Ramirez WG. Most frequent complications related to a peripheral venipuncture. CINA Res [Internet]. 2019; 3(3):41-45. Available from: https://journals.uninavarra.edu.co/index.php/cinaresearch/article/view/187
  9. Ngashangva L, Bachu V, Goswami P. Development of new methods for determination of bilirubin. J Pharm Biomed Anal [Internet]. 2019; 162:272-285. DOI: 10.1016/j.jpba.2018.09.034
  10. Ramachandran A, Owen L, Morris R. Un proyecto comunitario sobre ictericia. Niño [Internet]. 2016;12(4):125-9. DOI: 10.1136/archdischild-2015-308599.110
  11. Hernández-Ávila CE, Carpio N. Introducción a los tipos de muestreo. Alerta [Internet]. 2019; 2(1):75-79. Available from: https://alerta.salud.gob.sv/introduccion-a-los-tipos-de-muestreo
  12. Souza DL, Korzenowski AL, Alvarado MM, Sperafico JH, Ackermann AEF, Mareth T, et al. A systematic review on lean applications' in emergency departments. Healthcare (Basel) [Internet]. 2021; 9(6):763. DOI: 10.3390/healthcare9060763
  13. Haron SHA, Ramlan R. Patient Process Flow Improvement: Value Stream Mapping. J Manag Res [Internet]. 2015;7(2). DOI: 10.5296/jmr.v7i2.6988
  14. Marin-Garcia JA, Vidal-Carreras PI, Garcia-Sabater JJ. The role of value stream mapping in healthcare services: A scoping review. Int J Environ Res Public Health [Internet]. 2021; 18(3):951. DOI: 10.3390/ijerph18030951
  15. Le DX, Do HT, Bui KT, Hoang TQ, Nguyen GH, Nguyen AV, et al. Lean management for improving hospital waiting times-Case study of a Vietnamese public/general hospital emergency department. Int J Health Plann Manage [Internet]. 2022; 37(1):159-170. DOI: 10.1002/hpm.3310
  16. Al Muflih A, Noor-E-alam M. Integrated Lean Concept to Healthcare Delivery Framework for Urgent Care at Home. In: Proceedings of the International Conference on Industrial Engineering and Operations Management [Internet]. 2021. Available from: https://ieomsociety.org/proceedings/2021haiti/210.pdf
  17. de Barros LB, Bassi LC, Caldas LP, Sarantopoulos A, Zeferino EBB, Minatogawa V, et al. Lean healthcare tools for processes evaluation: An integrative review. Int J Environ Res Public Health [Internet]. 2021; 18(14):7389. DOI: 10.3390/ijerph18147389
  18. Kaushik N, Khangulov VS, O'Hara M, Arnaout R. Reduction in laboratory turnaround time decreases emergency room length of stay. Open Access Emerg Med [Internet]. 2018; 10:37-45. DOI: 10.2147/OAEM.S155988
  19. McClean S, Baerg K, Smith-Fehr J, Szafron M. Cost savings with transcutaneous screening versus total serum bilirubin measurement for newborn jaundice in hospital and community settings: a cost-minimization analysis. CMAJ Open [Internet]. 2018; 6(3):e285-e291. DOI: 10.9778/cmajo.20170158
  20. Boudreaux ED, O'Hea EL. Patient satisfaction in the Emergency Department: a review of the literature and implications for practice. J Emerg Med [Internet]. 2004; 26(1):13-26. DOI: 10.1016/j.jemermed.2003.04.003
  21. Health Committee. The Use of New Medical Technologies within the NHS Fifth Report of Session 2004-05 [Internet]. London (GBR): House of Commons; 2005. Available from: https://publications.parliament.uk/pa/cm200405/cmselect/cmhealth/398/398ii.pdf
  22. Rathore M, Jackson M, Committee on Infectious Diseases, Byington CL, Maldonado YA, Barnett ED, et al. Infection Prevention and Control in Pediatric Ambulatory Settings. Pediatrics [Internet]. 2017; 140(5):e20172857. DOI: 10.1542/peds.2017-2857
  23. Bhatt DR, Henry AIK, Sunjeeve CL, David W, Bhutani VK, Maisels MJ, et al. Transcutaneous bilirubinometer use and practices surrounding jaundice in 150 California newborn intensive care units. J Perinatol [Internet]. 2018; 38(11):1532-1535. DOI: 10.1038/s41372-018-0154-3
  24. Chua BS, Song LH, Chang CT, Lim XJ, Nachiappan J. Drive-through transcutaneous bilirubin screening for neonatal jaundice: A safe and efficient system during the COVID-19 pandemic. J Paediatr Child Health [Internet]. 2021; 57(1):12-14. DOI: 10.1111/jpc.15226
  25. van den Esker-Jonker B, den Boer L, Pepping RMC, Bekhof J. Transcutaneous bilirubinometry in jaundiced neonates: A randomized controlled trial. Pediatrics [Internet]. 2016; 138(6):e20162414. DOI: 10.1542/peds.2016-2414
  26. Rylance S, Yan J, Molyneux E. Can transcutaneous bilirubinometry safely guide phototherapy treatment of neonatal jaundice in Malawi? Paediatr Int Child Health [Internet]. 2014; 34(2):101-107. DOI: 10.1179/2046905513Y.0000000050
  27. Johnson SM, Vasu V, Marseille C, Hill C, Janvier L, Toussaint P, et al. Validation of transcutaneous bilirubinometry during phototherapy for detection and monitoring of neonatal jaundice in a low-income setting. Paediatr Int Child Health [Internet]. 2020; 40(1):25-29. DOI: 10.1080/20469047.2019.1598126