Relationship between physical activity levels and body fat percentage in gym users, Lima, Peru

Relationship between physical activity levels and body fat percentage in gym users, Lima, Peru

Relación entre los niveles de actividad física y el porcentaje de grasa corporal en usuarios de un gimnasio, Lima-Perú

Relação entre níveis de atividade física e porcentagem de gordura corporal em frequentadores de academia, Lima, Peru

Citation: Cruz-Melipil MA, Vela-Grandez ML, Gomez-Rutti YY, Guillermo Cruz-Velásquez O, Veliz-Manrique CD. Relación entre los niveles de actividad física y el porcentaje de grasa corporal en usuarios de un gimnasio, Lima-Perú. Univ Salud [Internet]. 2025; 27(3):e9155. DOI: 10.22267/rus.252703.349.


# ABSTRACT

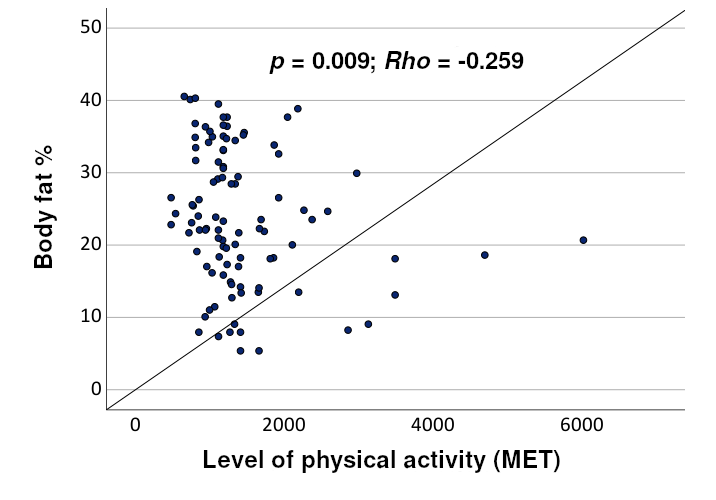
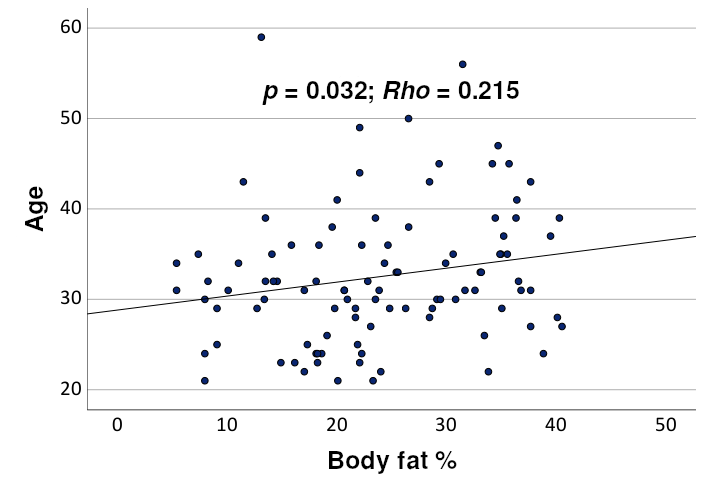
Introduction: Physical activity is fundamental in lifestyle and is a determinant factor in body fat percentage. Physical inactivity leads to the risk of chronic noncommunicable diseases. Objective: To determine the relationship between physical activity and body fat percentage in gym users. Material and methods: The study was quantitative and cross-sectional. The International Physical Activity Questionnaire (IPAQ) was used and skinfolds were used to determine body fat. The sample was 100 subjects. Spearman's Rho statistical test and Mann-Whitney U test were used. Results: 92% had a moderate level of physical activity and 5% a vigorous level, 34% had a normal body fat percentage and 17% low. There is a relationship between the level of physical activity and body fat (p = 0.009, Rho = -0.259), likewise there is a relationship between body fat and age (p = 0.032, Rho = 0.215). Physical activity level (MET sedentary) was found to be a significant predictor of BMI (B = -0.004; β = -0.239; p = 0.034). Conclusion: Gym users with a vigorous level of physical activity had a lower fat percentage compared to sedentary physical activity users who had a higher fat percentage. Higher levels of physical activity are associated with lower body mass index.

Keywords: Physical activity; Body, fat; Sedentary lifestyle; Anthropometry (Source: DeCS, Bireme).

Sustainable development goals: Good health and well-being. (Source: SDG, WHO).


# RESUMEN

Introducción: La actividad física es fundamental en el estilo de vida, factor determinante en el porcentaje de grasa corporal. La inactividad física conlleva al riesgo de enfermedades crónicas no transmisibles. Objetivo: Determinar la relación entre la actividad física y el porcentaje de grasa corporal en usuarios de un gimnasio. Material y métodos: Estudio tipo correlacional, cuantitativo y transversal. Se utilizó el Cuestionario Internacional de Actividad Física (IPAQ), para determinar grasa corporal se consideró pliegues cutáneos. La muestra fue 100 sujetos. Se utilizó prueba estadística Rho de Spearman y U de Mann-Whitney. Resultados: El 92 % tiene nivel de actividad física moderado, el 5 % un nivel vigoroso, el 34 % presentó porcentaje de grasa corporal normal y el 17 % bajo. Existe una relación entre el nivel de actividad física con grasa corporal (p = 0,009; Rho = -0,259), asimismo, relación entre grasa corporal y edad (p = 0,032; Rho = 0,215). El nivel de actividad física (MET sedentario) fue un predictor significativo del IMC (B = -0,004; β = -0,239; p = 0,034). Conclusión: Los usuarios del gimnasio que desarrollan un nivel de actividad física vigoroso presentaron un porcentaje de grasa menor comparado con usuarios de actividad física sedentario, quienes poseen un porcentaje de grasa mayor. Niveles más altos de actividad física se asocian con un menor índice de masa corporal.

Palabras clave: Actividad física; Cuerpo adiposo; Sedentarismo; Antropometría (Fuente: DeCS, Bireme).

Objetivos de desarrollo sostenible: Salud y bienestar. (Fuente: ODS, OMS).


# RESUMO

Introdução: A atividade física é fundamental no estilo de vida e é um fator determinante na percentagem de gordura corporal. A inatividade física conduz ao risco de doenças crónicas não transmissíveis. Objetivo: Determinar a relação entre a atividade física e a percentagem de gordura corporal em utilizadores de ginásio. Material e métodos: O estudo foi quantitativo e transversal. Foi utilizado o Questionário Internacional de Atividade Física (IPAQ) e as dobras cutâneas para determinar a gordura corporal. A amostra foi de 100 indivíduos. Foi utilizado o teste estatístico Spearman's Rho e o teste U de Mann-Whitney. Resultados: 92 % tinham um nível de atividade física moderado e 5 % um nível vigoroso, 34% tinham uma percentagem de gordura corporal normal e 17 % uma percentagem de gordura corporal baixa. Existe uma relação entre o nível de atividade física e a gordura corporal (p = 0,009; Rho = -0,259), bem como uma relação entre a gordura corporal e a idade (p = 0,032; Rho = 0,215). O nível de atividade física (MET sedentário) foi considerado um preditor significativo do IMC (B = -0,004; β = -0,239; p = 0,034). Conclusão: Os utilizadores de ginásio com um nível vigoroso de atividade física tinham uma percentagem de gordura mais baixa em comparação com os utilizadores de atividade física sedentários que tinham uma percentagem de gordura mais elevada. Níveis mais elevados de atividade física estão associados a um menor índice de massa corporal.

Palavras-chave: Atividade física; Corpo adiposo; Estilo de vida sedentário; Antropometria (Fonte: DeCS, Bireme).

Objetivos desenvolvimento sustentáve: Saúde e bem-estar. (Fonte: MDS, OMS).


# INTRODUCTION

The Pan American Health Organization (PAHO) mentioned that excess weight and obesity are directly related to exaggerated accumulation of fat deposits in the body system, which leads to negative health effects1. People with an insufficient level of physical activity have a 20% to 30% higher risk of death compared to people who reach a sufficient level of physical activity2. Furthermore, the National Institute of Health of Peru3 showed an increase in overweight and obesity in people over 15 years of age from 2013 to 2020, reaching a total of 37.9% for overweight and 24.6% for those suffering from obesity. In 2020, there was a 62.8% prevalence of people with excess weight.

Lack of physical activity and a sedentary lifestyle are the primary factors that increase the risk of death worldwide. Furthermore, the hours a person spends sitting at work in the office or teleworking are some of the sedentary behaviors that contribute to the increase in overweight and obesity, decreasing energy expenditure. Likewise, Cortés et al.4 mentioned that when a person sits for many hours, they tend to eat, which generally leads to a preference for foods high in calories, rich in fat and sugar. Apart from, there may be too much sodium, which leads to an inadequate diet, contributing to excess weight, which is harmful to health.

Martínez et al.5, stated that the factors that induce excess body fat are the decrease in the practice of body movement and the development of sedentary lifestyle, leading to leptin resistance causing pathologies associated with heart and blood vessel diseases, diabetes mellitus, hypertension, respiratory pathologies, and different types of cancer. In the same way, weight gain may be related to an increase in the percentage of body fat distributed in different parts of the body and is not necessarily due to the increase in lean mass, other factors including eating habits, consumption of high-calorie foods and inadequate portions.

Gym users attend for different personal goals, including reducing their body fat percentage, increasing lean mass, and losing weight, regardless of the percentages of body compartments. However, they also attend to socialize, improve their mood, and address stress, among other factors.

There is little published evidence on the variables of studies in gym users, therefore, the study's objective is to determine the relationship between physical activity and body fat percentage in gym users.


# MATERIALS AND METHODS

The research design is quantitative, correlational, cross-sectional and was developed from September to November 2023.

# Population and sample

The population consisted of users who regularly attend a gym in the San Miguel district of Lima. The sample consisted of 100 gym users, using a non-probability convenience sample. Inclusion criteria were users aged 18 to 60 years, who exercised three to four times a week, who had been training for more than six months, who were not athletes, and who did not have any special diet, such as: high-protein, low-protein, vegan, vegetarian, raw vegan, low-sodium, high-calorie, or low-calorie. Exclusion criteria included users who had ingested food or liquids prior to data collection, and who took supplements and/or fat burners.

# Variable and instruments

It is worth noting that to determine the sample's physical activity level, the short version of the IPAQ questionnaire6 was used. This questionnaire consists of seven questions that aim to obtain data on the regularity, extent, and intensity of the physical activity performed by the subject surveyed during the last 7 days. The total information is collected and converted into METs per minute per week. The MET is the unit of measurement for the metabolic rate (the amount of energy consumed by an individual at rest). The total sum of the METs collected in the surveys will indicate the level of physical activity of the subject surveyed by interpreting it within the following categories: Sedentary from 0 to 599 METs, Moderate from 600 to 1499 METs, and Vigorous from 1500 METs or more6,7.

To estimate the percentage of body fat, the Siri formula8, was used, using measurements of four body folds: triceps fold, bicipital fold, subscapular fold and suprailiac fold in three different measurements made by the same evaluator in order to obtain the measurements accurately. Along with these measurements, the values of the coefficients C (coefficient associated with the regression constant) and M (coefficient related to the age and sex of the individual) proposed by Durnin and Womersley9 were considered to find body density. The values of these coefficients are determined by age and sex.

To find the density, Durnin and Womersley proposed the following formula according to sex:

Once the Density value was found, the Siri equation was performed, with the following formula8:

In this respect, the classification of fat percentage was: thin (men < 8%, women <15%), optimal (men between 8.1% to 15.9%, women between 15.1% to 20.9%), slightly overweight (men between 16% to 20.9%, women between 21% to 25.9%), overweight (men between 21% to 24.9%, women between 26% to 31.9%) and obese (men greater than or equal to 25%, women equal to or greater than 32%)10.

# Data collection

The study objective was explained to the participants and they were given informed consent, which they agreed to and signed, thus allowing them to participate in the research. The study began with the administration of the IPAQ questionnaire, followed by anthropometric measurement to determine the 4-component skinfold pattern using a caliper. A stadiometer and scale were also used to determine other measurements.

The ISAK protocol11 was used to measure the four skinfolds, with a 2.1% technical error. The subject's clothing and hygiene (cleanliness and no body creams) were very important. Men were evaluated wearing shorts, and women wore shorts and a sports bra. Both sexes had to have slept at least six hours and had not exercised for four hours prior to the evaluation. The measuring tool was a Slim Guide brand caliper with a 0.5 mm accuracy and a double spring. All measurements were taken from the subject's right side.

Height measurements were recorded using a standardized wooden height rod validated by National Center for Food and Nutrition (known in Spanish as CENAN). Weight measurements were determined using an OMRON HBF-514C scale, which allowed for accurate recording of body weight.

Permission and authorization were obtained from the gym's legal representative. Gym users participated voluntarily and signed informed consent. The research applied the bioethical standards established by the Declaration of Helsinki12 and the National Code of Scientific Integrity, issued by the National Council of Science and Technology (known in Spanish as CONCYTEC)13.

# Statistical analysis

SPSS 26 software was used for data analysis. A descriptive analysis of the data was performed. The Kolmogorov-Smirnov normality test was performed. The data did not show normality, so a nonparametric test such as Spearman's Rho correlation was used to relate physical activity level and body fat percentage to the study variables. The Mann-Whitney U test was also used to determine whether there were differences in body fat percentage by sex.

Multiple linear regression was used to calculate the mean BMI percentage in units adjusted for body fat percentage, MET categories per week, and age. A significance level of p < 0.05 was applied.


# RESULTS

Gym users had an average age of 32 years (SD = 7.54), ranging in age from 21 to 59 years. Forty-three percent were women and 57% were men. Ninety-two percent of gym users had a moderate level of physical activity, 5% vigorous, and 3% sedentary. Similarly, according to body fat percentage classification, 34% were optimal, 30% obese, 19% overweight, and 17% lean.

Users had an average weight of 72.39 kg ± 10.94 SD, an average height of 1.67 ± 0.09 SD, an average physical activity level of 1431.19 METs ± 248.49 SD, and a body fat percentage of 23.9% ± 9.48 SD.

Table 1 shows that, of the total number of users, 25% of women were obese and 24% of men had a normal body fat percentage. On another note, around 40% of both men and women had a moderate physical activity level. It was also evident that there is a difference in the body fat percentage between men and women, with women showing a higher percentage of body fat in contrast to men (p = 0.001).

# Table 1. Body fat percentage and physical activity level by sex among gym users in San Miguel, Lima
Body fat %Physical activity level %
LowNormalLimitObesitySedentaryModerateVigorous
Male12241653495
Female5103250430
p-value0.0010.186

Figure 1 shows that users who performed a vigorous level of activity had a lower percentage of fat compared to users who obtained a sedentary level of activity, who showed a higher percentage of fat (p = 0.009; Rho = -0.259). On the other hand, with age, the percentage of fat increases (p = 0.032; Rho = 0.215) (Figure 2).

# Figure 1. Relationship between the level of physical activity and the percentage of body fat - gym users
<fig>Figure 1</fig>. Relationship between the level of physical activity and the percentage of body fat - gym users
# Figure 2. Relationship between age and body fat percentage - gym users
<fig>Figure 2</fig>. Relationship between age and body fat percentage - gym users

In Table 2, the linear regression analysis showed that the level of physical activity (sedentary MET) was a significant predictor of BMI (B = -0.004; β = -0.239; p = 0.034). This outcome shows that higher levels of physical activity are associated with a lower body mass index. The model explained a significant proportion of the variance in BMI, with a 95% confidence interval for the coefficient between -0.008 and -0.001.

# Table 2. Multiple linear regression to predict BMI
ModelUnstandardized coeficientsStandardized coefficientstSig.95.0 % CI
BDesv. ErrorβLLUL
(Constant)26.7541.72315.5270.00023.33330.176
Body fat %-0.0080.035-0.026-0.2320.817-0.0770.061
Vigorous MET-0.0010.000-0.161-1.5570.123-0.0010.000
Moderate MET0.0000.002-0.017-0.1580.875-0.0030.003
Sedentary MET-0.0040.002-0.239-2.1510.034-0.0080.001
Age0.0070.0400.0180.1710.864-0.0720.086

# DISCUSSION

It is important to highlight that the research aimed to determine the relationship between the level of physical activity and percentage of fat. The study findings showed that users who performed a vigorous level of activity had a lower percentage of fat compared to users who obtained a sedentary level of activity who showed a higher percentage of fat (p = 0.009) and women showed a higher percentage of fat than men (p = 0.001). A similar result was evidenced by Gamarra et al.14, in their research, they found a correlation between these variables (p = 0.024), predominating the percentage of fat in women. This means that when a person develops regular physical activity, their body experiences an increase in caloric expenditure. This implies that they consume more calories, generating a possible state of caloric deficit, which causes the reduction of body weight. Regular and well-dosed physical activity can help oxidize fat and maintain an adequate body weight. In addition, exercise can influence the release of leptin, a hormone responsible for regulating appetite, which would help avoid excesses in the diet, thus maintaining the state of caloric deficit by reducing the percentage of fat15.

Also, the study by Escobar3 showed that the higher the level of physical activity, the lower the proportion of body fat. In addition, the research found that the percentage of body fat and age are positively related with a p-value of 0.032, in this regard the study by Durnin and Womersley9 who indicated that there is a progressive obesity that results from a reduction in the levels of physical activity and metabolism, which is attributed to the increase in body fat.

The study found that physical activity level (sedentary METs) was a significant predictor of BMI (B = -0.004; β = -0.239; p = 0.034). One study found a statistically significant association between physical activity and BMI (β = -0.08; p = 0.0018)16, engaging in regular and higher levels of physical activity appears to improve overall health and well-being, help control overweight and obesity, and reduce the risk of obesity-related diseases17. Apart from that, meeting the physical activity recommendations of at least 150 minutes per week was associated with a BMI 0.82 kg/m2 lower in men [β = -0.80 kg/m2; 95% confidence interval (CI): -1.14 to -0.47] and 0.68 kg/m2 lower in women (β = -0.68 kg/m2; 95% CI: -1.03 to -0.33)18.

The research findings show the importance of promoting a healthy lifestyle and physical activity together to control body weight and reduce the risks associated with obesity. Therefore, personalized training and proper nutritional guidance will promote better eating habits. Consequently, the increase in the overweight and obese adult population is a cause for great concern due to its significant growth in recent years. This is a topic that warrants greater attention in Peru. Understanding the cause of these increases in this population is of utmost importance, as is how it relates to physical inactivity, contributing to the development of various diseases such as metabolic syndrome.

Related to the research sample, we worked with gym users who ranged in age from 18 to 59 years, with the most predominant gender being male with 57%, as opposed to female with 43%. In this sense, as indicated in their study by Baile et al.19, the reason why men initially attend the gym is because they have body dissatisfaction and tend to focus on the aesthetic aspect, not on physical health, in this way they exercise for a long time because their goal is to achieve the desired picture hoping to develop muscle mass, they lift weights to have more strength in their muscles, or modify their physical appearance in certain parts of their body, there is an urgent need to promote and/or reformulate strategies that seek to optimize these components of physical fitness20.

Regarding body fat, the study showed that 34% of participants were classified as normal, followed by 30% as obese. This is more prevalent in women. This diagnosis leads to cardiovascular disease and risk of death. This can be explained by Power and Schulkin21, who showed that sex hormones such as estrogen in women have the ability to stimulate the accumulation of adipose tissue in areas such as the hips, thighs, and buttocks. By comparison, androgens in men tend to promote fat deposition in the abdominal area, therefore, the percentage of fat is always higher in women.

Therefore, limitation of the research was that participants from other gyms in the area were not involved and the results of the study could not be extrapolated to other contexts.


# CONCLUSION

Users who engaged in vigorous activity had a lower percentage of body fat compared to users who engaged in sedentary activity. Besides that, higher levels of physical activity are associated with a lower body mass index. Nutritional counseling and physical activity for optimal health is important.


# REFERENCES

  1. Pan American Health Organization. Obesity prevention [Internet]. PAHO; 2020. Available from: https://www.paho.org/en/topics/obesity-prevention
  2. World Health Organization. Physical activity. OMS; 2022. Available from: https://www.who.intes/news-room/fact-sheets/detail/physical-activity
  3. National Center for Food and Nutrition. Technical document: Overweight and obesity in the Peruvian population; 2020. Available from: https://observateperu.ins.gob.pe/images/archivos/sala_nutricional/2020/a_sobrepeso_obesidad_poblacion_peruana/sobrepeso_y_obesidad_en_la_poblacion_peruana.pdf
  4. Cortés-Romero CE, Escobar-Noriega A, Cebada-Ruiz J, Soto-Rodríguez G, Bilbao-Reboredo T, Vélez-Pliego MV. Stress and cortisol: Implications for food intake. Rev Cubana Invest Bioméd [Internet]. 2018; 37(3):1-17. Available from: http://scielo.sld.cu/scielo.php?script=sci_arttext&pid=S0864-03002018000300013
  5. Martinez-Atienzar LI, Jiménez-Espinoza A, Tarraga-Marcos L, Madrona-Marcos F, Tárraga-López PJ. Obesity: An epidemic in today's society. Analysis of different types of treatment: motivational, pharmacological, and surgical. Rev Jonnpr [Internet]. 2019; 4(11):1147-1213. DOI: https://doi.org/10.19230/jonnpr.3209
  6. Carrera R. International Physical Activity Questionnaire (IPAQ). REDT [Internet]. 2017; 7(11):49-54. Available from: https://dialnet.unirioja.es/descarga/articulo/5920688.pdf
  7. Mantilla-Toloza SC, Gómez-Conesa A. The International Physical Activity Questionnaire. A suitable instrument for monitoring population physical activity. Elsevier [Internet]. 2007; 10(1):48-52. DOI: https://doi.org/10.1016/S1138-6045(07)73665-1
  8. Siri WE. Body composition from fluid spaces and density: Analysis of methods. En: Brozeck J, Henschel A eds. Techniques for measuring body composition. Washington DC (USA): National Academy of Sciences, Natural Resourcer Council; 1961. 223-244.
  9. Durnin JV, Womersley J. Body fat assessed from total body density and its estimation from skinfold thickness: Measurements on 481 men and women aged from 16 to 72 years. Br J Nutr [Internet]. 1974; 32(1):77-97. DOI: https://doi.org/10.1079/bjn19740060
  10. Forbes GB. Human body composition: Growth, aging, nurition, and activity. New York (USA): Springer Science & Bussiness media; 2012. Disponible en: https://books.google.com.co/books/about/Human_Body_Composition.html?id=A9XTBwAAQBAJ&redir_esc=y
  11. The International Society for the Advancement of Kinanthropometry. ISAK. Available from: https://isak.global
  12. Manzini JL. Helsinki Declaration: Ethical Principles for Medical Research Involving Human Subjects. Acta Bioeth [Internet]. 2000; 6(2):321-334. DOI: https://doi.org/10.4067/S1726569X2000000200010
  13. CONCYTEC. Código Nacional de Integridad Científica. (PER); 2019. Available from: https://portal.concytec.gob.pe/images/publicaciones/Codigo-integridad-cientifica.pdf
  14. Gamarra-Camacho ML, Miranda Flores MA, Saintila J, Javier-Aliaga DJ. Correlation between physical activity, body fat, and BMI in college students: A cross-sectional study. Nutr Clín Diet Hosp [Internet]. 2022; 41(4):112-118. DOI: https://doi.org/10.12873/414aliaga
  15. Rosado EL, Monteiro JB, Chaia V, Lago MF. Effect of leptin in the treatment of obesity and influence of diet on the secretion and action of the hormone. Nutr Hosp [Internet]. 2006; 21(6):686-693. Available from: http://scielo.isciii.es/scielo.php?script=sci_arttext&pid=S0212-16112006000900009&lng=es
  16. Galasso L, Amicis R, Castelli L, Ciociari A, Mulé A, Battezzati A, et al. The moderating effect of physical activity on the relationship between sleep quality and BMI in overweight and obese adults. Front Sports Act Living [Internet]. 2025; 7:1455731. DOI: https://doi.org/10.3389/fspor.2025.1455731
  17. Muscogiuri G, Barrea L, Annunziata G, Di Somma C, Laudisio D, Colao A, et al. Obesity and sleep disorders: The chicken or the egg? Crit Rev Food Sci Nutr [Internet]. 2019; 59(13):2158-2165. DOI: https://doi.org/10.1080/10408398.2018.1506979
  18. Muti M, Ware LJ, Micklesfield LK, Ramsay M, Agongo G, Boua PR, et al. Physical activity and its association with body mass index: A cross-sectional analysis in middle-aged adults from four sub-Saharan African countries. J Phys Act Health [Internet]. 2023; 20(3):217225. DOI: https://doi.org/10.1123/jpah.2022-0539
  19. Baile-Ayensa JI, Guillén-Grima F, Garrido-Landlvar E. Body dissatisfaction in adolescents measured with the Body Shape Questionnaire (BSQ): Effect of anonymity, sex and age. Int J Clin Health Psychol [Internet]. 2002; 2(3):439-450. Available from: https://www.redalyc.org/articulo.oa?id=33720304
  20. Arrieta-Aspilcueta AG. Relationship between body composition, cardiorespiratory fitness, and muscular endurance in Peruvian male firefighters. RPCAFD [Internet]. 2021; 8(2):11291138. Available from: https://dialnet.unirioja.es/descarga/articulo/9155766.pdf
  21. Power ML, Schulkin J. Sex differences in fat storage, fat metabolism, and the health risks from obesity: Possible evolutionary origins. Br J Nutr [Internet]. 2008; 99(5):931-940. DOI: https://doi.org/10.1017/S0007114507853347