

National Survey of Nutritional Situation in Colombia: A scoping review of the generated scientific publications

National Survey of Nutritional Situation in Colombia: A scoping review of the generated scientific publications

National Survey of Nutritional Situation in Colombia: A scoping review of the generated scientific publications

Citation: Gómez-Velásquez S, Serna-Duque AS, Mantilla-Avendaño SP, Sierra-Gómez AM. Encuesta Nacional de Situación Nutricional en Colombia: Una revisión de alcance de las publicaciones científicas generadas. Univ Salud [Internet]. 2026; 28(3):e9798. DOI: 10.22267/rus.262803.9798.


# ABSTRACT

Introduction: The National Survey of Nutritional Situation in Colombia (ENSIN) constitutes the main statistical benchmark regarding the population's nutritional status, providing key data to guide research and support public health policies. Objective: To characterize the scientific productions derived from ENSIN, identifying research themes, analyzed nutritional indicators, and knowledge gaps reported in the literature. Materials and methods: A narrative review was conducted across PubMed, Scopus, LILACS, and Google Scholar (2005-2025) following SANRA guidelines. The protocol was previously registered on the Open Science Framework platform. Results: A total of 53 scientific publications derived from ENSIN were identified. Dietary intake emerged as one of the most studied indicators with 15 articles (18.2%), overweight and obesity with 16 (19.5%), and physical activity with 9 (10.9%). Meanwhile, 4 articles individually addressed a single indicator each — vitamin D, vitamin A, zinc, and height deficit (1.1% each) — whereas the remaining 9 publications analyzed various secondary epidemiological topics, revealing significant thematic gaps. Conclusion: Scientific production based on ENSIN reflects an uneven and inefficient utilization of this dataset, concentrating heavily on a few indicators while leaving multiple thematic areas underused. Optimizing the comprehensive use of this scientific data will foster the generation of robust evidence to guide future research and inform public policies regarding national nutrition.

Keywords: Nutrition surveys; Surveys and questionnaires; Data collection. (Source: DeCS, Bireme).

Sustainable development goals: Zero hunger; Good health and well-being; Reduced inequalities. (Source: SDG, WHO).


# RESUMEN

Introducción: La Encuesta Nacional de Situación Nutricional en Colombia (ENSIN) constituye el referente estadístico principal sobre el estado nutricional poblacional, aportando datos clave para orientar investigaciones y respaldar políticas públicas en salud. Objetivo: Caracterizar la producción científica derivada de la ENSIN, identificando temáticas investigadas, los indicadores nutricionales analizados y los vacíos de conocimiento. Materiales y métodos: Revisión narrativa en PubMed, Scopus, LILACS y Google Scholar (2005-2025) con lineamientos SANRA. El protocolo fue registrado previamente en la plataforma Open Science Framework. Resultados: Se identificaron 53 publicaciones científicas derivadas de la ENSIN. La ingesta dietaria es el indicador más estudiado con 15 artículos (18,2 %), sobrepeso y obesidad 16 (19,5 %) y actividad física 9 (10,9 %). Por su parte, 4 artículos abordaron individualmente un único indicador vitamina D, vitamina A, zinc y déficit de talla (1,1 % cada uno); 9 publicaciones restantes analizaron diversos tópicos epidemiológicos, evidenciando importantes vacíos temáticos en la investigación. Conclusión: La producción científica basada en la ENSIN refleja un aprovechamiento aún heterogéneo e ineficiente, concentrándose marcadamente en pocos indicadores y dejando múltiples áreas temáticas subutilizadas. Optimizar el uso integral de esta información científica favorecerá la generación de evidencia sólida para orientar futuras investigaciones y fortalecer las políticas públicas en nutrición nacional.

Palabras clave: Encuestas nutricionales; Encuestas y cuestionarios; Recolección de datos. (Fuente: DeCS, Bireme).

Objetivos de desarrollo sostenible: Hambre cero; Salud y bienestar; Reducción de las desigualdades. (Fuente: ODS, OMS).


# RESUMO

Introdução: A Pesquisa Nacional do Situação Nutricional da Colômbia (ENSIN) é a principal referência estatística sobre o estado nutricional da população, fornecendo dados essenciais para orientar pesquisas e apoiar políticas públicas de saúde. Objetivo: Caracterizar a produção científica derivada da ENSIN, identificando os temas de pesquisa, os indicadores nutricionais analisados e as lacunas de conhecimento na literatura. Materiais e métodos: Foi realizada uma revisão narrativa nas bases de dados PubMed, Scopus, LILACS e Google Scholar (2005-2025), seguindo as diretrizes da SANRA. O protocolo foi previamente registrado na plataforma Open Science Framework. Resultados: Foram identificadas 53 publicações científicas provenientes da ENSIN. A ingestão alimentar foi um dos indicadores mais estudados, com 15 artigos (18,2%), seguida por sobrepeso e obesidade, com 16 (19,5%), e atividade física, com 9 (10,9%). Quatro artigos abordaram individualmente um único indicador: vitamina D, vitamina A, zinco e baixa estatura (1,1% cada), enquanto as nove publicações restantes analisaram outros tópicos epidemiológicos diversos, evidenciando lacunas temáticas significativas na pesquisa. Conclusão: La producción científica basada en la ENSIN refleja un aprovechamiento aún heterogéneo e ineficiente de esta base de datos, concentrándose marcadamente en pocos indicadores y dejando múltiples áreas temáticas subutilizadas. Optimizar el uso integral de esta información científica favorecerá la generación de evidencia sólida para orientar futuras investigaciones y fortalecer de manera informada las políticas públicas en nutrición nacional.

Palavras-chave: Inquéritos nutricionais; Inquéritos e questionários; Coleta de dados. (Fonte: DeCS, Bireme).

Metas de desenvolvimiento sustentavel: Fome zero; Saúde e bem-estar; Redução das desigualdades. (Fonte: MDS, OMS).

# INTRODUCTION

Nutritional status is defined as the result of the balance between dietary energy and other essential nutrient requirements and expenditure. At the population level, it is observed and analyzed to characterize the scenarios to which people are exposed. Thus, a country's nutritional situation corresponds to the food, physical, socioeconomic, and environmental conditions surrounding its population. These conditions determine population health and make it possible to describe or estimate aspects such as food security, malnutrition, and quality of life, among others1.

Inadequate nutritional status occurs when imbalances converge in conditions related to diet, physical activity, or genetic factors, causing disruption of the body's homeostasis and leading to disease or illness, as well as changes in serum markers and even syndromes. Examples include anemia in cases of undernutrition and metabolic syndrome in cases of overnutrition2.

Lack of knowledge about a country's nutritional situation has important implications for the health of its inhabitants, including difficulty identifying current evidence on which to base national planning3, limited knowledge of health priorities, greater complexity in evaluating public policies, and multiple procedural obstacles for health professionals.

In the political and administrative context, one of the main tools implemented to measure social and health conditions is the use of demographic surveys. These surveys make it possible to identify aspects requiring intervention in the population, such as access to food, the quality of education, public services and resources, or changes in the prevalence of diseases and events of interest4. Population surveys therefore emerge with a specific focus on policies or topics, such as nutrition or food surveys, which are widely used to assess food and nutrient consumption at the population or individual level and determine whether individuals' nutritional requirements are being met. Countries implement these surveys to characterize the current nutritional situation of their populations, identify trends, and keep public policy, intervention, and research agendas up to date5.

Different surveys are applied around the world specifically addressing nutritional topics, such as the National Health and Nutrition Examination Survey (NHANES)6 in the United States, led by the National Center for Health Statistics (NCHS)7 , which is part of the Centers for Disease Control and Prevention (CDC) and is responsible for producing health statistics for the United States; the National Health Survey of Spain (NHSOS - ENSE)8 and the Spanish Population Nutrition Study (SPNS - ENPE); the ENSE is conducted by the Ministry of Health, Consumer Affairs and Social Welfare in collaboration with the National Statistics Institute, and is also part of the National Health System's Information System (SNS), being conducted every five years9.

In Latin America, the Health and Nutrition Survey (ENSANUT) is conducted under the same acronym in both Mexico and Ecuador10; in Mexico's case, the survey is the responsibility of the National Health Surveys System, the Ministry of Health, the National Institute of Public Health (INSP), and the National Institute of Statistics and Geography (INEGI), which added a nutritional focus to the survey starting in 2006.

In Colombia, the National Survey of Nutritional Situation (ENSIN) has been conducted since 2005. It is a national reference study aimed at analyzing the food and nutritional situation of the Colombian population within the social determinants framework, as an input for the formulation, monitoring, and reorientation of public policies on food and nutrition security in Colombia. It is conducted every five years with support from the Colombian Family Welfare Institute (ICBF), the Ministry of Health and Social Protection (MINSALUD), the Pan American Health Organization (PAHO), the National Administrative Department of Statistics (DANE), and entities such as the National University of Colombia and the Colombian Association for the Advancement of Science (ACAC)11.

To date, three editions of the National Survey of Nutritional Situation in Colombia (ENSIN) have been conducted (2005, 2010, and 2015); their results have made it possible to characterize changes in dietary practices, identify processes of nutritional transition, and describe the conditions influencing the nutritional status of the Colombian population11. Due to its national representativeness and broad thematic scope, ENSIN constitutes a strategic source of information for guiding research, public health monitoring, and evidence-based policy formulation.

Despite technological advances and the evolution of tools for characterizing health status, ENSIN continues to be one of the main sources of information for analyzing the nutritional status of the Colombian population. However, the most recent available edition corresponds to 2015, meaning that the information has lost currency and relevance12.

Although ENSIN has been widely used as a source of information for formulating and evaluating public policies, the extent of its use in national and international scientific production is unknown, as are the topics addressed, the most studied indicators, and the existing research gaps. Characterizing this landscape is relevant for identifying opportunities to make better use of this data source, guiding future research, and strengthening the generation of evidence in nutrition and public health, especially in the context of the delay in implementing a new round of the survey.

In this context, the present narrative review aimed to characterize the scientific production derived from ENSIN, describing the main research themes, the nutritional indicators analyzed, and the knowledge gaps reported in the literature.


# MATERIALS AND METHODS

A structured narrative review was conducted with the aim of characterizing the scientific production derived from the National Survey of Nutritional Situation in Colombia (ENSIN). The methodological process followed the definitions for narrative reviews set out in the Scale for the Assessment of Narrative Review Articles (SANRA)13, with the purpose of ensuring a systematic search, selection, and synthesis of the available scientific literature.

The protocol was registered on the Open Science Framework on May 22, 2024, as a guarantee of transparency and reproducibility of the scientific process, while also seeking to support the research and enable cooperation; the protocol is available at https://doi.org/10.17605/OSF.IO/S9VN7

Eligibility criteria: Original articles identified in the databases PubMed, Scopus, LILACS, and Google Scholar, published between January 2005 and August 2025, in Spanish or English, were included. The search strategy used the terms "ENSIN" and "Encuesta Nacional de Situación Nutricional," present in the title, abstract, or keywords of the articles.

Studies were selected based on the following inclusion criteria: 1) using data from any of the editions of the National Survey of Nutritional Situation in Colombia (ENSIN 2005, 2010, or 2015) as the primary source for analyzing variables related to nutrition, food, or health, and 2) conducting analyses in the Colombian population. For this review, use of ENSIN data was considered to be any research that employed the database or the indicators derived from the survey to carry out statistical analyses, associations, estimates, or interpretations of results.

Literature reviews, editorials, letters to the editor, protocols, book chapters, theses, conference abstracts, and technical reports were excluded.

When duplicate records or different versions of the same publication were identified, only the final published version was retained. In cases of studies available in more than one language, a single version of the article was included, prioritizing the one published in the original journal.

# Search strategy

The search process was carried out in the PubMed, Scopus, and LILACS databases, additionally including Google Scholar as a complementary source to identify scientific articles published in peer-reviewed journals that met the eligibility criteria; for this purpose, the "allintitle" operator was used in order to increase the specificity of the search and retrieve documents whose title explicitly mentioned ENSIN or one of its equivalent designations. This decision made it possible to reduce the high volume of irrelevant results generated by full-text searching and to concentrate retrieval on publications in which ENSIN constituted the central component of the study. The search was conducted independently in each database, implementing the following search string: TITLE-ABS (ENSIN OR "Encuesta Nacional de Situación Nutricional" OR "Colombian National Nutritional Survey") PUBYEAR > 2005. These terms were selected based on the descriptors available in the DeCS and MeSH thesauri. In addition, the previously established filters for the publication period (2005-2025) and language (Spanish and English) were applied. In Google Scholar, potentially eligible publications were identified; however, in accordance with the eligibility criteria, only scientific articles published in peer-reviewed journals were included. The search strings used for each database are presented below (Table 1).

# Table 1. Search strings used and number of resulting articles
Database Search string Results
LILACS ensin OR "Encuesta Nacional de Situación Nutricional" OR "Colombian National Nutritional Survey" AND fulltext:("1" OR "1") AND la: ("es" OR "en") AND (year_cluster:[2005 TO 2025]) AND instance:"regional" 92
SCOPUS TITLE-ABS (ensin OR "Encuesta Nacional de Situación Nutricional" OR "Colombian National Nutritional Survey") AND PUBYEAR > 2004 AND PUBYEAR < 2025 AND (LIMIT-TO (LANGUAGE, "English") OR LIMIT-TO (LANGUAGE. "Spanish")) 58
PUBMED ENSIN[Title/Abstract] OR "Encuesta Nacional de Situación Nutricional"[Title/Abstract] OR "Colombian National Nutritional Survey" [Title/Abstract] 40
GOOGLE SCHOLAR allintitle: ENSIN OR "Encuesta Nacional de Situación Nutricional" OR "Colombian National Nutritional Survey" 110
  1. Common core: ENSIN OR "Encuesta Nacional de Situación Nutricional" OR "Colombian National Nutritional Survey".
  2. Note: The search string was adapted for each database due to differences in indexing structure, syntax, operators, search fields, and filtering options, while maintaining a common core of terms related to ENSIN.

Evidence selection: Studies obtained through the search were exported to the collaborative software RAYYAN, which enabled filtering of the available articles through the removal of duplicates, a process carried out by four reviewers. Discrepancies arising during screening were resolved through discussion and consensus among the reviewers involved, based on a joint re-review of the record and verification of the selection criteria. This procedure made it possible to contrast individual decisions, reduce potential subjective interpretations, and promote consistent application of the eligibility criteria. Finally, full texts were reviewed to verify strict compliance with the selection criteria for the final articles.

Data consolidation process: Data extraction was carried out from RAYYAN into an Excel spreadsheet, recording the title, journal name, authors, abstract, keywords, year, DOI, indicators analyzed, population type, statistical analysis, and sample size for each article that would be part of the final review. The consolidation process was preceded by a final consensus among the review team, validating full compliance with the eligibility criteria.


# RESULTS

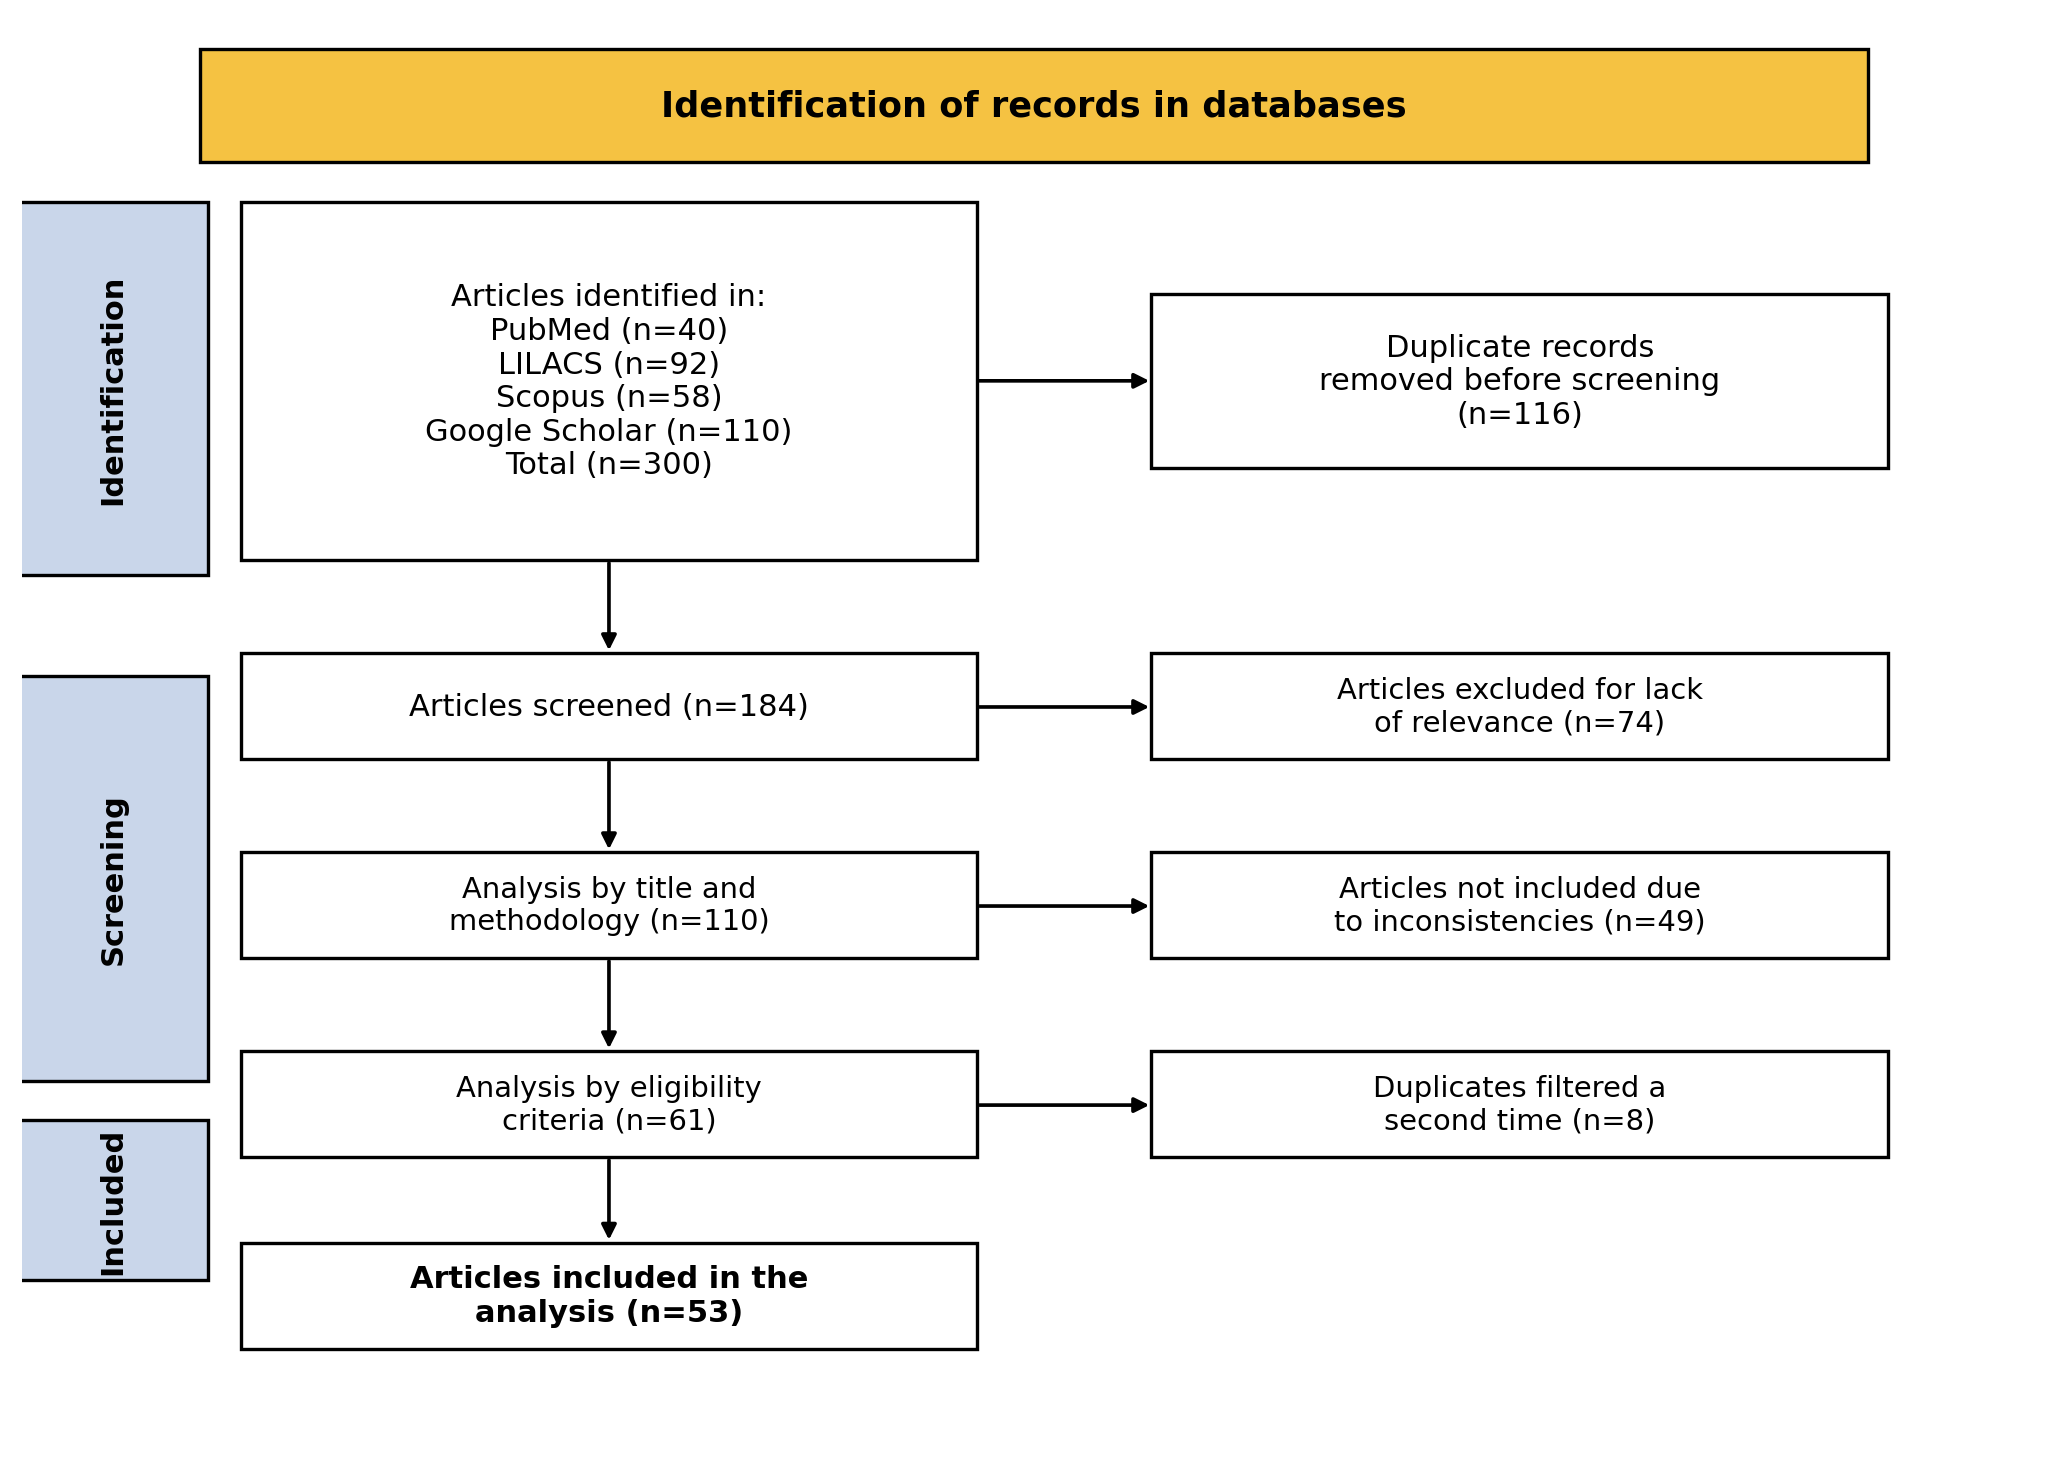
A total of 300 articles were initially identified; after filtering duplicate records, 184 references remained. Continuing with selection according to the proposed inclusion and exclusion criteria, 61 texts were retained in total; during consolidation of the resulting texts, articles published in English and Spanish that showed duplication in the record were identified, so that the final result was 53 articles selected for the review and analysis process (Figure 1).

# Figure 1. Flow diagram of the different phases of the review
<b>Figure 1. </b>. Flow diagram of the different phases of the review

    Since its first implementation in 2005, the National Survey of Nutritional Situation (ENSIN) has undergone significant changes in its methodologies; each round has introduced changes in sample size, thematic focus, and the breadth of the data collected (Table 2)11,14.

    # Table 2. Main methodological differences among ENSIN 2005, 2010, and 2015
    Methodological elements 2005 2010 2015
    Sample size and characteristics 17,740 households, concentrated in 1,920 segments, from 209 Primary Sampling Units (PSU), mainly municipalities. Population aged 0 to 64 years. Departmental representativeness indicators. The rural population of Orinoquía and Amazonía was excluded. Probabilistic design 50,000 households, 6 regions, 14 subregions, concentrated in 253 primary sampling units (municipalities). Indicators with national representativeness. Orinoquía and Amazonía were excluded, but population centers were added. Population aged 0 to >64 years. Household Food Security (HFS) was measured in the population up to age 75 44,202 households, concentrated in 295 municipalities grouped into 238 primary sampling units. National representativeness indicators. Population aged 0 to 64 years. Self-perception
    Reference population International reference population from the National Center for Health Statistics and from the Centers for Disease Control and Prevention in Atlanta Guidelines established by WHO Guidelines established by WHO
    Research impact approach Health condition approach Risk approach Social determinants of health
    Anthropometry Weight and height were measured in the population aged 0 to 64 years, and waist circumference between 18 and 64 years. For classification, children aged 0-5 years used the W/A, H/A, and W/H indicators; between 5 and 17 years the H/A and BMI/age indicators; and for adults aged 18 to 64 years, BMI was used. Pregnant women were assessed using gestational BMI Weight and height were measured in people aged 0 to 64 years, and waist circumference in the population aged 18 to 64 years. Low birth weight was determined by maternal interview, for children born alive in the 5 years prior to the survey. For classification, children under 5 years used the W/A, H/A, and W/H indicators; between 5 and 19 years the H/A and BMI/A indicators; and for adults aged 20 to 64 years, BMI was used. Pregnant women were assessed using gestational BMI Weight and height were measured in people aged 0 to 64 years, and waist circumference from 18 to 64 years. For classification, children under 5 years were assessed using the W/A, H/A, and W/H indicators; between 5 and 17 years the H/A and BMI/A indicators; and for adults aged 18 to 64 years, BMI was used. Pregnant women were assessed using gestational BMI. Women up to three months postpartum were excluded from waist circumference measurement, as were people with differentiated cognitive and/or physical disabilities
    Biochemical markers Iron (serum ferritin and hemoglobin) was measured in children aged 0 to 12 years, women of childbearing age, and pregnant women. Vitamin A (retinol) and serum zinc were measured in children aged 1 to 4 years Hemoglobin was measured in pregnant women, women of childbearing age, and children aged 6 months to 17 years; Vitamin A (retinol) and zinc in children aged 1 to 4 years; folic acid in pregnant women, women of childbearing age, children aged 1 to 12 years, and children aged 13 to 17 years; ferritin was applied in children aged 1 to 12 years, women of childbearing age, and pregnant women; and calcium in pregnant women Levels of ferritin, vitamin B12, and vitamin D were determined in children aged 1 to 4 years, children aged 5 to 12 years, adolescents aged 13 to 17 years (vitamin D only in males), women of childbearing age 13 to 49 years, and pregnant women aged 13 to 49 years; hemoglobin from 6 months to 49 years, including pregnant women. Vitamin A (retinol) and zinc were applied in children aged 1 to 4 years; urinary iodine was measured in children aged 5 to 12 years and women of childbearing age 13 to 49 years, along with CRP
    Breastfeeding and complementary feeding Information on breastfeeding was obtained regarding the last child born alive aged 0 to 4 years, and complementary feeding with breast milk referred to the last child born alive aged 0 to 23 months. A questionnaire was applied to inquire about breastfeeding initiation, reasons for not breastfeeding, daily breastfeeding frequency, breastfeeding duration, bottle use, initiation of complementary feeding, food frequency, food consumption in children aged 6 to 23 months, consumption of Bienestarina and food supplements in children aged 6 to 23 months, food preparation, and accompaniment during meals Breastfeeding practices were assessed for the last child born alive aged 0 to 4 years, and complementary feeding practices for the last child born alive aged 0 to 36 months. All children under 5 years were asked whether they had been breastfed or not. Questions on exclusive breastfeeding up to 6 months, daily frequency, breastfeeding duration, age of introduction of complementary foods, bottle use, frequency of complementary foods, daily meal frequency, dietary variety, and supplement use were included. The question "Was there training?" was changed to "Source of training?" The questionnaires of the National Demographic and Health Survey and the forms applied in ENSIN 2005 and 2010 were used as a basis, along with infant and young child feeding indicators established by the United Nations International Children's Emergency Fund and the World Health Organization. One part was directed at all reported live-born children, and another at the last child born alive. "Necessary amount of complementary foods" was included
    Food security The Household Food Security Scale, previously adapted and validated, was used. The scale measures the degree of severity of household food insecurity; questions were addressed to the head of household or their spouse The HFSS + the Latin American and Caribbean Food Security Scale (ELCSA) were used The Latin American and Caribbean Food Security Scale (ELCSA) + FAO Methodology + Coping Strategies Index (CSI) + questionnaires from the National Demographic and Health Survey (ENDS) were used. Information such as household-level production, self-supply, purchase, use of natural resources, exchanges, subsidies, donations, and food cost was included
    Physical activity and free play Measured using the International Physical Activity Questionnaire (IPAQ); leisure time or recreation, transportation, work activities, and household activities were assessed. Applied to men and women aged 13 to 64 years Measured in the population aged 18 to 64 years; rural areas were not considered Estimated using the following questionnaires: Questionnaire for the Measurement of Physical Activity and Sedentary Behavior (C-MAFYCS), Youth Risk Behavior Surveillance System (YRBSS), and the International Physical Activity Questionnaire (IPAQ) in the populations aged 3 to 5 years, 6 to 17 years, pregnant women, and adults aged 18 to 64 years, respectively. Grip strength was estimated in all groups except the 3-to-5-year group. Maximum strength was estimated as a cardiovascular risk indicator for the whole population, except for the 3-to-5-year age group. Only pregnant women without contraindications were assessed
    Dietary intake Information was collected using a 24-hour recall, applied to men and women aged 2 to 64 years (pregnant women were excluded). Intake of energy, protein, lipids, carbohydrates, fiber, vitamin A, vitamin C, folic acid, zinc, calcium, and iron was analyzed, along with consumption of dairy, eggs, legumes, vegetables, fruit, cereals, tubers and plantains, carbonated drinks, alcoholic beverages, fast food, Bienestarina, and lesser-known foods A one-month food frequency method was used to measure intake. Consumption of fruit, vegetables, and fats was assessed in those over 5 years old; sources of iron and folic acid in pregnant women, women of childbearing age, and girls aged 1 to 17 years; zinc in children aged 5 to 13 years and pregnant women; and calcium in all age groups Measured using a 24-hour recall and consumption frequency, based on the Multiple-Pass Method (MPM). Assessed consumption of protein, fat, carbohydrates, vitamin A, vitamin C, calcium, iron, folate, zinc, daily consumption of each food group, native/traditional foods, alcohol, number of meals per day, and place of consumption
    Self-perceived body weight A questionnaire was applied to people aged 13 to 64 years, stratified by age group: 13 to 17 years, 18 to 29 years, and 30 to 64 years. Pregnant women were excluded A questionnaire was applied to the population aged 13 to 64 years A composite variable was constructed from BMI and self-reported body weight perception, used across the same individuals and their reports differentiated by group
    Self-reported T2DM and hypertension Self-report questions to estimate prevalence in people aged 18 to 64 years Not measured Not measured
    Time spent watching TV and playing video games videojuegos Applied to children aged 5 to 12 years. Daily ranges were established: less than 2 hours, 2 to 3 hours, and 4 hours or more Measured in children aged 5 to 17 years. Daily ranges were established: less than 2 hours, 2 to 3 hours, and 4 hours or more Excessive screen time was analyzed (TV, computer, video games, tablets, or cell phone) in children aged 6 to 17 years
    Data collection National Demographic and Health Survey National Demographic and Health Survey Ministry of Health and Social Protection

      The size of each ENSIN varied depending on the primary sampling units included in each cycle. The surveys have presented a different thematic focus, which has evolved over time. In 2005, the main focus was the health condition of the Colombian population; in 2010, exposure to risk factors; and in 2015, emphasis was placed on the social determinants of health.

      Regarding the measurement of biochemical indicators, each ENSIN has modified both the number of biomarkers assessed and the age ranges of the population analyzed. In 2005, the markers assessed included iron, vitamin A, and zinc; however, in 2010 other indicators were added, such as C-reactive protein (CRP), vitamin B12, folic acid, and calcium, and by 2015, vitamin D and iodine. This increase in indicators has enabled a more complete analysis of the population's nutritional status11,12,14.

      The assessment of breastfeeding and complementary feeding progressed from the use of a non-validated questionnaire in 2005 and 2010 to incorporating a questionnaire derived from the National Demographic and Health Survey (ENDS) in 2015 and adopting the infant and young child feeding indicators recommended by the United Nations International Children's Emergency Fund (UNICEF) and the World Health Organization (WHO). While some indicators have maintained the same measurement methodology, such as physical activity and food security, different improvements and adjustments were identified as having been implemented in later rounds of the survey. For physical activity, the International Physical Activity Questionnaire (IPAQ) was used in all rounds, to which other instruments were later added; for example, in 2015 the Questionnaire for the Measurement of Physical Activity and Sedentary Behavior (C-MAFYCS) and the Youth Risk Behavior Surveillance System (YRBSS) were added, and the population studied was expanded to include pregnant women without contraindications. Regarding food security, the Latin American and Caribbean Food Security Scale (ELCSA) was used, together with additional methodologies for 2015, such as the Coping Strategies Index and questionnaires from the National Demographic and Health Survey (ENDS)11,12,14.

      In the measurement of dietary intake, the methodology has varied over the years. In 2005, the 24-hour recall method was used, while in 2010 a monthly food frequency approach was applied. For 2015, both methodologies were combined, allowing for a more detailed analysis of the population's dietary habits11,12,14 .

      The only survey that included self-reported chronic diseases such as type 2 diabetes mellitus (T2DM) and arterial hypertension was the first round in 2005; subsequent surveys did not add specific questions on these diseases11,12,14.

      Finally, regarding data collection, the 2005 and 2010 rounds received methodological support from the National Demographic and Health Survey (ENDS). For the 2015 round, the Ministry of Health and Social Protection (MSPS) was responsible for data collection11,12,14.

      # Analysis of the articles by indicator and study population

      With regard to population, the studies were concentrated mainly on the general population, followed by children, pregnant women, and adolescents, while breastfeeding women and infants during the breastfeeding period were scarcely represented. Regarding the concept studied, the 53 articles included addressed 17 indicators, with a predominance of dietary intake, overweight and obesity, and physical activity, evidencing greater attention to dietary behaviors, adiposity, and lifestyles; in contrast, indicators related to vitamin A, vitamin D, zinc, and height deficit were analyzed to a lesser extent. Regarding context, ENSIN 2010 was the most frequently used source of information, followed by ENSIN 2015 and ENSIN 2005, and only a small proportion of studies made comparisons between different rounds of the survey. Taken together, these findings show scientific production concentrated on certain indicators, populations, and periods of ENSIN, as well as knowledge gaps in micronutrients, breastfeeding, and longitudinal or comparative analyses between survey rounds. In addition, one study was identified that aimed to evaluate the properties of the food insecurity scales used in ENSIN, which, although it did not directly analyze a nutritional indicator, provided evidence on the quality of the instruments used for its measurement.

      The 17 indicators identified are detailed in Table 3; these group the articles according to the indicator of interest, the reference for each article, the year of the ENSIN round, and a summary of the overall results for each group. It is worth noting that one of the most prevalent indicators was dietary intake, present in 15 articles (18.2%), overweight and obesity with 16 articles (19.5%), and physical activity with 9 articles (10.9%). The indicators with the lowest reporting included vitamin D, vitamin A, zinc, and height deficit values, with only 1 article each (1.1% respectively), while the remaining 9 publications analyzed various other epidemiological topics, evidencing significant thematic gaps in the research.

      # Table 3. Main indicators by population and ENSIN round
      Indicator Number of articles Population ENSIN Conclusions
      Vitamin B12 deficiency 2 (2.4%) Children and adolescents - non-pregnant women 2010 According to ENSIN 2010 data, among children and adolescents aged 5 to 17 years the mean proportion for vitamin B12 deficiency was 19.8%; of these, 13.8% experienced monetary poverty and inequality, and this indicator tended to decrease in departments with average poverty levels. Among pregnant women, indigenous ethnicity, residence in the eastern region, and living in a rural area were associated with the lowest vitamin B12 values, with 18.6% presenting concentrations below 200 µg/mL and 41.3% between 200 and 300 µg/mL15,16
      Pregnant women 2010
      Anemia due to hemoglobin deficiency 4 (4.8%) Children 2005 The four articles identified focus on factors related to hemoglobin-deficiency anemia. For ENSIN 2005, the indicator was associated with chronic malnutrition, global malnutrition, and school dropout and absenteeism among children and adolescents; children with anemia showed chronic malnutrition in 66.2% of cases, global malnutrition in 57.1%, and low weight in 70.5%17.For 2010, the mean prevalence of anemia in children and adolescents aged 5 to 17 years was 5.6%; this indicator was associated with inequality17. Among women, prevalence that same year was 13.4%; older age was associated with lower hemoglobin values and iron deficiency, and anemia prevalence tended to decrease in the presence of adiposity markers18. Finally, among pregnant women, the lowest mean hemoglobin concentrations were found among those with no schooling, from the Atlantic region, and of indigenous or Afro-Colombian ethnicity
      Children, adolescents and non-pregnant women 2010
      Non-pregnant women 2010
      Pregnant women 2010
      Excessive screen time (TV and video games) 7 (8.5%) Children 2005 For 2005, 41.5% of children reported television exposure of less than 2 hours/day, 36.8% between 2 and 3.9 hours/day, and 21.7% 4 or more hours/day. Screen use tended to increase proportionally with age and was higher among boys and among children living in urbanized areas. Cross-tabulation with overweight showed that exposure of 2 to 3.9 hours of TV increased the probability of overweight. According to ENSIN 2010, 29.2% of the adolescent population watched less than 2 hours of TV per day and 70.8% watched 2 hours or more; again, an association between overweight and TV consumption was found. In 2015, the indicator included other behaviors associated with physical activity and sedentary patterns. Only 4.8% of preschool children met movement guidelines, while 16.6% met none. Children without a TV in their bedroom were more likely to meet movement guidelines; that same year, 76.6% of adolescents reported excessive screen time, more than 65% owned video games and a smartphone, 47% had a TV in their bedroom, and only 7.6% of the adolescent population met movement guidelines20-24
      Children 2005
      Children and adolescents 2010
      Adolescents 2010
      Children 2015
      Preschool children 2015
      Children and preschool children 2015
      Food insecurity 5 (6.0%) Children 2005 ENSIN 2005 reported food insecurity (FI) in 54.2% of households, differentiated into three severity levels: 31.9% mild FI, 13.8% moderate, and 8.5% severe, with higher rates in female-headed households. The questionnaires applied measured coping strategies, finding that 24% of households in FI with children received help from neighbors or relatives to provide food for their children. For 2010, the country's capital reported monetary poverty levels (associated with food insecurity) of 13.1%, Chocó reported 64%, and the mean FI proportion for the whole country was 48.6%. Finally, in 2015 nearly 62% of households experienced FI, with half corresponding to FI in female-headed households25,26,27,28,29,30
      Adolescents 2010
      Children and adolescents 2015
      Households 2015
      Preschool children 2015
      Malnutrition 3 (3.6%) Preschool children 2010- 2015 Regarding the prevalence of chronic malnutrition in children in Colombia, studies indicated a slight decrease from 13.2% in 2010 to 10.8% in 2015. However, acute malnutrition increased from 0.9% to 1.6% over the same period. Geographic disparities are notable, with 15.4% growth stunting in rural areas versus 9% in urban areas. In addition, indigenous children were found to be six times more likely to experience growth stunting26,31,32
      Non-pregnant women and children 2015
      Children 2015
      Overweight and obesity 16 (19.5%) General population 2015 To address overweight and obesity, Meisel JD and Esguerra V developed a model based on ENSIN 2010 and 2015 data indicating a possible significant increase in obesity prevalence among women through 203033. In 2015, 49.8% of women in rural households presented maternal obesity, and a double nutritional burden was identified in 75% of children with overweight or obesity. Overweight prevalence in children decreased, from 11.1% in 2005 to 4.3% in preschool children by 2015. In 2010, overweight affected 35.8% of women and 36.2% of men, while obesity stood at 21.9% and 12.8%, respectively. By 2015, abdominal obesity reached 53.5%, being 22.6 percentage points higher in women than in men. Among adolescents, 20.4% presented excess weight, with a higher proportion among males. Studies also identified an increase in adult obesity, from 13.7% in 2005 to 18.7% in 2015, with a higher prevalence among women. Methods such as body mass index (BMI) and waist circumference indicate that abdominal obesity is more common than general obesity and is associated with factors such as maternal educational level and birth weight31,32,34-39
      Children 2005
      General population 2005
      General population 2010
      Adolescents 2010
      General population 2010
      Breastfeeding women 2010
      General population 2010
      Children 2015
      Children and preschool children 2015
      Non-pregnant women 2015
      General population 2015
      Adolescents 2015
      Households 2015
      Children and adolescents - non-pregnant women 2015
      General population 2005, 2010, 2015
      Physical activity 9 (10.9%) General population 2010 Regarding physical activity, Meisel JD and Esguerra V developed a model based on ENSIN 2010 and 2015 data indicating a possible significant decrease in physical activity prevalence among women by 203033. The studies suggest that physical activity programs could be a key strategy for addressing the growing burden of obesity among women.In 2010, physical inactivity prevalence in the general population reached 93.7%, with women being the most inactive (93.7% versus 87.8% of men). In addition, physically inactive women showed a higher odds ratio (OR 1.30, 95% CI 1.03-1.62) for negative self-perceived health status. In 2015, only 12.5% of pregnant women remained physically active during their leisure time, while 19.1% of preschool children and 28.2% of schoolchildren met the recommended 180 minutes per week of physical activity; 33.8% spent most of their time in sedentary activities. In addition, 53.2% of adolescents with excess weight did not perform strength exercises despite participating in school physical activity programs. Adherence to physical activity guidelines was only 21.4% among schoolchildren, and 16.6% of preschool children met none of the movement recommendations20,21,40,41.
      Non-pregnant women 2010
      Children and preschool children 2015
      Pregnant women 2010, 2015
      General population 2015
      Adolescents 2015
      General population 2015
      General population 2015
      Preschool children 2015
      Dietary intake 15 (18.2%) General population 2005 Between 2005 and 2015, studies identified important changes in food consumption habits in Colombia. Fothergill et al found that in 2005 mean intake of flour-type foods ranged from 58.9 g/d in children aged 2 to 4 years to 77.3 g/d in children aged 5 to 12 years; regarding sodium intake from total food without added salt42, Gaitán et al identified a mean intake of 816.4 mg/d in the general population43. Related evidence also found that higher socioeconomic status (SES) was associated with lower consumption of cereals and fats and higher consumption of dairy and fruit. For 2010, Herrán et al showed that in the general population the dietary pattern adherence score had a mean value of 0.67 for the fruit-vegetable/dairy pattern and 0.87 for the traditional/starch pattern44. In this context, 17% of pregnant women reported consuming at least one carbonated drink daily, and 23% of girls and 22.4% of boys consumed sugar-sweetened beverages at least once a week. Between 2010 and 2015, evidence in children showed a decrease in the frequency of consumption of milk, meat, tuna, offal, and legumes, which was not offset by an increase in egg and chicken consumption. In 2015, the mean usual frequency of red meat consumption in the general population was 0.49 times/day and that of eggs 0.76 times/day, with no significant differences by sex. That same year, only 0.4% of respondents over age 50 reported consuming dairy products daily, with cow's milk, cottage cheese, and yogurt the most consumed (24, 28, 29, 31, 39, 45, 46, 47, 48, 49, 50, 51, 52, 53, 54, 55).
      General population 2005
      General population 2005
      Pregnant women 2005
      General population 2010
      Households 2010
      Children and preschool children 2010
      Children and adolescents 2010
      General population 2010
      General population 20102015
      Older adults 20102015
      General population 2015
      General population 2015
      General population 2015
      General population 2015
      Preschool children 2010
      General population 2010
      Preschool children 2010
      Vitamin A 1 (1.1%) General population 2010 Vitamin A was analyzed in only one study, which revealed that in 2010, 24.3% of preschool children had vitamin A levels below 20 μg/dL, indicating subclinical deficiency. Afro-descendant children, those residing in the Orinoquía and Amazonía regions, and the 12-to-23-month age group showed the highest rates of subclinical vitamin A deficiency, at 29.5%, 31.1%, and 27.6%, respectively50
      Vitamin D 1 (1.1%) Children and non-pregnant women 2010 Castillo, in 2015, showed that children from the eastern region (OR 3.03, 95% CI 1.12-8.16, p = 0.029) and from the city of Bogotá (OR 4.15, 95% CI 1.65-12.32, p = 0.004) were associated with impaired bone mineralization due to vitamin D deficiency32
      Zinc 1 (1.1%) Non-pregnant women 2010 The study by Martínez et al revealed that in 2010, 43.3% (95% CI 42.2%-44.3%) of children had zinc levels below 65 μg/dL. Children belonging to indigenous ethnic groups and those residing in rural areas showed zinc deficiency rates of 56.3% and 47.8%, respectively. Logistic regression models indicated that indigenous ethnicity (OR 1.76, 95% CI 1.29-2.41) and residing in rural areas (OR 1.39, 95% CI 1.16-1.67) were significantly associated with zinc deficiency56
      Anemia due to ferritin deficiency 7 (8.5%) Children 2010 For 2005, low serum ferritin was reported to be prevalent in 26.4%, 11.9%, and 20.3% of children aged 2 to 4 years, children aged 5 to 12 years, and non-pregnant women aged 13 to 49 years, respectively. For 2010, 37.2% of pregnant women had ferritin levels below 12 µg/L and 23% of non-pregnant women reported a ferritin prevalence below 15 µg/L, while among preschool children and children, 10.6% and 3.5%, respectively, had ferritin levels below 12 µg/L. Finally, for 2015 the mean ferritin level was found to be 41.9 μg/L in men and 35.7 μg/L in women18,19,42,54,57.
      Pregnant women 2010
      Preschool children 2015
      Pregnant women 2015
      Non-pregnant women 2010
      Adolescents 2010
      General population 2010
      Self-perceived health status 3 (3.6%) General population 2010 The study by Mendoza et al, conducted in 2010 among women aged 13 to 49 years, showed that the overall frequency of poor or fair self-perceived health was 25.5%. Likewise, Mendoza et al reported that 22.9% of women and 31.3% of men perceived their health status as fair or poor. Finally, in 2015 the study by Poveda-Acelas et al, conducted among the adolescent population, found that 50% of them presented excess weight and tended to perceive their health as inadequate21,40
      Households 2010
      Infants 2010
      Waist circumference 2 (2.4%) Infants 2010 The study related to this indicator found that for 2010, in the population aged 20 to 64 years, mean waist circumference was 88.4 cm in men and 85.6 cm in women. For 2015, mean waist circumference was 86.6 cm in men and 83.8 cm in women35,58
      Breastfeeding women 2010
      Breastfeeding 3 (3.6%) Preschool children 2010 Three studies conducted in 2010 found that among infants under six months of age, the prevalence of exclusive breastfeeding was 34.4%, and that 57.6% of infants stopped exclusive breastfeeding before six months. Finally, the mean duration of exclusive breastfeeding was found to be 1.18 months36
      Pregnant women 2010
      Pregnant women 2010
      Height deficit (stunting) 1 (1.1%) This study compared the WHO reference with that of the U.S. National Center for Health Statistics, finding that the prevalence of height deficit was higher when using the WHO standard (boys: 36.1% and girls: 33.8%) than with the U.S. National Center for Health Statistics (NCHS) standard (boys = 28.2% and girls = 27.5%). Agreement between the two references was good, except among 2-year-old children, where it was moderate. More than one in four children presented height deficit under both anthropometric references, with the highest prevalence found in the Atlantic region59
      Supplements during pregnancy 2 (2.4%) Two studies from 2010 reported that 62.6% of the pregnant women studied indicated taking prenatal dietary supplements at some point during their pregnancy. The percentage of women who met supplementation recommendations for iron, calcium, and folic acid was 93.5%, 85.2%, and 89.1%, respectively60

        When analyzing the populations with the highest frequency of study, different populations were observed across the studies, among which it is worth highlighting that the general population (0 to 67 years) was the most studied, with a total of 27 articles. Next are children, without discrimination into age subcategories, with 9 articles. Pregnant women were the study population in 8 of the articles, while non-pregnant women were the focus subjects in 5 articles. Regarding Colombian households, 4 articles were found, and 6 were identified in the adolescent group. Finally, the least studied groups were breastfeeding women and infants during the breastfeeding period, with a total of 2 articles each.

        Focusing on the indicators with the highest frequency of articles, dietary intake was found to be studied mostly in the general population (12 of 18 articles, 66.6%). A similar pattern was observed for overweight and obesity, where the general population was the main focus (7 of 16 articles, 43.75%); physical activity was likewise concentrated in this same population (4 of 9 articles, 44.44%). Anemia due to ferritin deficiency focused specifically on pregnant women (2 of 7 articles, 28.6%) and excessive screen time on children (3 of 7 articles, 42.8%).

        When evaluating each of the ENSIN rounds implemented, the 2010 version was found to have the highest number of analyses of its results, with 37 articles, followed by ENSIN 2015 with 31, and ENSIN 2005, with 9 published explorations of its products. In addition, some authors combined different surveys: 6 articles used ENSIN in its 2010 and 2015 versions, and 2 articles studied aspects of ENSIN 2005 and 2010, one of which was excluded from the table of articles consolidated by indicator.

        During the grouping of publications according to their associated indicator, the article by Camargo et al27 was identified, in which a diagnostic technology evaluation was carried out, applying the Rasch Model to the Food Security Perception Scale (EPSA) used in the 2005 version of ENSIN and the Latin American and Caribbean Food Security Scale (ELCSA) from ENSIN 2010, in order to determine their performance and suitability for assessing household food insecurity. Although this article did comply with the analysis of a tool used to obtain ENSIN results, its methodology did not assess indicators, nor did it consider a specific population group from the survey; even so, this work was taken into account in establishing the conclusions, given its relevance to determining the quality of the tools applied across the different versions of the survey.


        # DISCUSSION

        This scoping review analyzed the existing literature that used the data provided by the 2005, 2010, and 2015 rounds of the National Survey of Nutritional Situation (ENSIN) in its methodologies and analyses. A total of 53 articles were included, which were classified according to ENSIN indicators. The most frequently assessed indicator was dietary intake, followed by overweight and obesity. The populations most represented in the studies were those aged 0 to 64 years and children.

        A comparative analysis of the 2005, 2010, and 2015 rounds of the National Survey of Nutritional Situation (ENSIN) reveals significant methodological differences. Among the most notable changes are: variations in sample size, a progressive expansion of the biochemical panel, a transition toward validated measurement instruments for assessing breastfeeding and complementary feeding practices, and the incorporation of new measurement instruments for physical activity and dietary intake. Finally, regarding data collection, methodological support was obtained from the National Demographic and Health Survey (ENDS) in 2005 and 2010, and from the Ministry of Health and Social Protection (MSPS) in 2015.

        Looking at the continental and global landscape, it is possible to identify different surveys that provide nutritional and health data on their populations through nationally representative measurements, aimed at generating evidence to strengthen the scientific component of public policies. These surveys have required methodological and procedural continuity in their application in order to remain current.

        The Health and Nutrition Survey (ENSANUT) conducted in Mexico has made it possible to quantify the evolution of the population's health and nutritional conditions and their determinants, as well as to analyze the organized social response to problems in these areas, and is conducted every six years. When making a periodic comparison between ENSIN 2005 and ENSANUT 2006, it is observed that the Mexican survey significantly expanded its scope by incorporating a household module that delves into sociodemographic and health aspects beyond nutritional status. This survey included questions on housing, use of health services, chronic diseases, mental health, accidents, violence, and reproductive health, in adults as well as in adolescents and children. In addition, information on food frequency and supplement consumption was expanded10,11.

        ENSANUT 2012 significantly expanded its scope compared to ENSIN 2010, incorporating new modules that delved into aspects such as cognitive status, disability, food security, and knowledge of nutritional programs. ENSANUT 2012 included more detailed health assessments in adults, adolescents, and children, as well as more precise anthropometric measurements. However, ENSIN 2010 provided more detailed information on biochemical markers such as calcium, vitamin A, and C-reactive protein14,45.

        Due to the accelerated increase in cases of overweight, obesity, and associated chronic diseases such as diabetes and hypertension, the Mid-Way National Health and Nutrition Survey (ENSANUT-MC) was conducted in 201661. Unlike previous surveys and ENSIN 2015, ENSANUT-MC delved into topics such as the quality of care for patients with diabetes and other chronic conditions, the population's perception of the risks of obesity, the relationship between sleep and obesity, the effectiveness of campaigns such as 'Chécate, mídete, muévete,' and nutritional labeling.

        Another relevant study on nutritional health conditions in the Latin American context is the National Nutrition and Health Survey (ENNYS) of Argentina62, which seeks to provide information on aspects related to nutrition through the assessment of multiple dimensions, including the frequency of consumption of different food groups, dietary habits, food and nutrient intake through a 24-hour recall (R24H), and breastfeeding. Two rounds have been conducted, the first in 2007 and the second in 2019.

        When comparing the methodologies of ENNYS and ENSIN, it is evident that ENNYS does not have an established periodicity, with a centralized population for 2007 of children older than 6 months up to 5 years, pregnant women, and women of childbearing age62; it is worth highlighting its similarity in procedures to ENSIN 2005, although it did include measurement of arm circumference62. For 2019, it was applied to boys, girls, and adolescents of both sexes aged 0 to 17 years, and to adults aged 18 years and older, and it also included an assessment of food advertising and labeling, which ENSIN does not have63.

        At the global level, other nutritional surveys are identified that have frequently been used as a reference for studying and assessing nutritional status. The National Health Survey of Spain (ENSE) established as its main objective the monitoring of the health of the population residing in Spain through the collection and analysis of a broad set of health-related aspects, disaggregated by demographic and socioeconomic characteristics and by autonomous community8. This survey is conducted every five years.

        When analyzing the evolution of the ENSE and ENSIN surveys, it is observed that ENSE has significantly expanded its scope over the years. While ENSIN 2005 focused solely on nutritional aspects, ENSE 2006 introduced socioeconomic and mental health variables in the adult population64. ENSE 2011-2012 delved further into health-related quality of life and housing characteristics, and ENSE 2017 incorporated questions on functional limitations and preventive practices8,65. ENSIN 2015, in turn, maintained a more limited focus, without addressing these new topics. This progression in ENSE reflects a trend toward a more comprehensive assessment of health, going beyond biological factors to consider social and environmental context.

        In the European context, the National Diet and Nutrition Survey (NDNS RP) of the United Kingdom also stands out, designed to assess the diet, intake, and nutritional status of the population in order to provide the government with an evidence base for policy development and to track progress toward public health nutrition objectives66. It has been conducted annually since 2008. When comparing the methodologies of NDNS RP and ENSIN, some significant differences stand out. NDNS RP categorizes population groups differently, including children from 1.5 years of age and adults from 19 years of age. In addition, this survey included urine sample collection in participants over 4 years of age. Regarding the assessment of food consumption, NDNS RP used a different approach, requesting information on food consumption over 4 consecutive days, rather than using a 24-hour recall as ENSIN does.

        Finally, the National Health and Nutrition Examination Survey (NHANES) of the United States is a survey that combines interviews with physical examinations, and since its implementation it has been useful for public health officials, legislators, and physicians responsible for creating health policies, programs, and services. It began in 1960 and is conducted annually, randomly selecting 5,000 residents in a confidential and voluntary manner; selected participants receive a personal interview and a standardized physical examination6.

        The National Survey of Nutritional Situation (ENSIN) in Colombia has presented significant methodological variations across its different rounds. These variations include sample size, the number of biochemical markers assessed, and the population's age ranges, with a transition from non-validated questionnaires to validated instruments, especially in areas such as breastfeeding and complementary feeding. Although some indicators, such as physical activity and food security, have maintained their measurement methodology, various improvements and adjustments have been implemented. However, ENSIN presents important gaps in the assessment of cognitive status, nutritional condition in the context of disability, and general characterization of the population's diabetes-related behavior. It also lacks indicators on the population's perception of obesity risks, does not include measurement of arm circumference, and does not assess aspects related to food advertising and labeling. Nor does it inquire about health-related quality of life, housing characteristics, functional limitations, and preventive practices, which limits its ability to offer a comprehensive picture of the country's nutritional situation6,8,11,14,45,61-66.

        When evaluating the final articles included in this review, it was observed that the indicators most frequently analyzed in the scientific production derived from ENSIN data were dietary intake, overweight and obesity, and physical activity. On the other hand, the indicators with the lowest reporting included vitamin D, vitamin A, and zinc levels, and height deficit, with only 1.1% representation each.

        In terms of the population studied, the general population (0 to 67 years) was the most frequently analyzed, with a total of 27 articles. In contrast, the least studied groups were breastfeeding women and infants during the breastfeeding period, with only 2 articles each. When examining the different ENSIN rounds, the 2010 round was found to have the highest number of analyses, with 37 articles, followed by ENSIN 2015 with 31 and ENSIN 2005 with 9 studies.

        The lack of continuity of ENSIN represents a critical obstacle to a comprehensive understanding of the country's food-related reality. This discontinuity in data collection prevents the tracking of nutritional and dietary trends, which limits the governments and institutions capacity to design and implement effective public policies.

        One limitation of this study is that the results may be subject to publication bias, since some unpublished studies or those belonging to the gray literature may not have been retrieved. Although Google Scholar was used as a complementary search source, only scientific articles published in peer-reviewed journals were included; the loss of sensitivity resulting from the use of "allintitle" was considered acceptable given the complementary role assigned to Google Scholar within the search strategy. In this context, restricting the search to the title made it possible to reduce the high number of non-specific results and to concentrate the search on documents in which ENSIN was a central component. Likewise, inclusion was restricted to publications in Spanish and English, so research available in other languages was not considered. Finally, since this is a narrative review, no formal assessment of the methodological quality of the included studies was conducted, a decision consistent with the objective of descriptively characterizing the available scientific production rather than synthesizing the effectiveness of an intervention.


        # CONCLUSION

        Scientific production derived from ENSIN shows uneven use of its data, with a predominance of studies on overweight, obesity, dietary intake, and physical activity, in contrast to limited exploration of micronutrients and other indicators. This reveals thematic gaps in the literature and, together with the absence of a new round since 2015, limits the updating of knowledge on the country's nutritional situation. Continuity of ENSIN needs to be strengthened, and the use of its data optimized, in order to expand scientific evidence and guide decision-making in nutrition and public health.


        # REFERENCES

        1. 1. Figueroa Pedraza D. Estado nutricional como factor y resultado de la seguridad alimentaria y nutricional y sus representaciones en Brasil. Rev Salud Publica [Internet]. 2004; 6(2):140-155. Disponible en: https://www.scielosp.org/pdf/rsap/2004.v6n2/140-155/es
        2. 2. Pérez-Ríos M, Santiago-Pérez MI, Leis R, Malvar A, Suanzes J, Hervada X. Prevalencia de malnutrición en escolares españoles. An Pediatr [Internet]. 2018; 89(1):44-49. DOI: https://doi.org/10.1016/j.anpedi.2017.09.001
        3. 3. Álvarez Castaño LS, Pérez Isaza EJ. Situación alimentaria y nutricional en Colombia desde la perspectiva de los determinantes sociales de la salud. Perspect Nutr Hum [Internet]. 2013; 15(2):203-214. DOI: https://doi.org/10.17533/udea.penh.19000
        4. 4. Ministerio de Salud y Protección Social de Colombia. La Encuesta Nacional de Demografía y Salud (ENDS) 2024 consultará a 52.000 hogares en Colombia [Internet]. Bogotá (COL): MinSalud; 2024 [citado 2025 Feb 24]. Disponible en: https://www.udea.edu.co/wps/wcm/connect/udea/8e594d33-5fd8-4dd4-820c-4b3cff2ddc25/Boletin+001+ENDS+2024.pdf?MOD=AJPERES&CVID=p6bGw
        5. 5. Gil Á, Martínez de Victoria E, Olza J. Indicadores de evaluación de la calidad de la dieta. Rev Esp Nutr Comunitaria [Internet]. 2015; 21(Suppl 1):127-143. Disponible en: https://renc.es/imagenes/auxiliar/files/NUTR.%20COMUN.%20SUPL.%201-2015%20_Calidad%20dieta.pdf
        6. 6. Centro Nacional de Estadísticas de Salud. Acerca de NHANES [Internet]. Atlanta (USA): Centers for Disease Control and Prevention; 2022 [citado 2023 Ago 25]. Disponible en: https://www.cdc.gov/nchs/nhanes/participant/spanish/participant-about-es.htm
        7. 7. Centers for Disease Control and Prevention. National Center for Health Statistics [Internet]. Atlanta (USA); [citado 2025 Feb 24]. Disponible en: https://www.cdc.gov/nchs/index.html
        8. 8. Ministerio de Sanidad de España. Encuesta Nacional de Salud de España 2017 [Internet]. Madrid (ESP): Ministerio de Sanidad; 2018 [citado 2025 Feb 24]. Disponible en: https://www.sanidad.gob.es/estadEstudios/estadisticas/encuestaNacional/encuestaNac2017/encuestaResDetall2017.htm
        9. 9. Observatorio de la Nutrición y de Estudio de la Obesidad. Encuesta Nacional de Salud de España (ENSE) [Internet]. Madrid (ESP): Agencia Española de Seguridad Alimentaria y Nutrición; [citado 2023 Ago 25]. Disponible en: https://www.aesan.gob.es/AECOSAN/web/nutricion/subdetalle/Encuesta_Nacional_Salud_Espana.htm
        10. 10. Instituto Nacional de Salud Pública de México. Encuesta Nacional de Salud y Nutrición 2006 [Internet]. Cuernavaca (MEX): Instituto Nacional de Salud Pública; [citado 2023 Ago 25]. Disponible en: https://ensanut.insp.mx/encuestas/ensanut2006/index.php
        11. 11. Instituto Colombiano de Bienestar Familiar. Encuesta Nacional de Situación Nutricional (ENSIN) [Internet]. Bogotá (COL): ICBF; [citado 2022 Oct 22]. Disponible en: https://www.icbf.gov.co/bienestar/nutricion/encuesta-nacional-situacion-nutricional
        12. 12. Instituto Colombiano de Bienestar Familiar. Encuesta Nacional de Situación Nutricional en Colombia (ENSIN) 2015: Nota de política [Internet]. Bogotá (COL): ICBF; 2018 [citado 2026 Jul 23]. Disponible en: https://www.icbf.gov.co/sites/default/files/nota-politica-ensin-mar11.pdf
        13. 13. Baethge C, Goldbeck-Wood S, Mertens S. SANRA-a scale for the quality assessment of narrative review articles. Res Integr Peer Rev [Internet]. 2019; 4(1):5. DOI: https://doi.org/10.1186/s41073-019-0064-8
        14. 14. Instituto Colombiano de Bienestar Familiar, Ministerio de Salud y Protección Social. Encuesta Nacional de la Situación Nutricional en Colombia (ENSIN) 2010: protocolo de la encuesta. Bogotá (COL): ICBF, MinSalud; 2010. Disponible en: https://www.minsalud.gov.co/sites/rid/Lists/BibliotecaDigital/RIDE/VS/ED/GCFI/Base%20de%20datos%20ENSIN%20-%20Protocolo%20Ensin%202010.pdf
        15. 15. Ramírez-Vélez R, Correa-Bautista JE, Martínez-Torres J, Meneses-Echávez JF, Lobelo F. Vitamin B12 concentration and its association with sociodemographic factors in Colombian children: Findings from the 2010 National Nutrition Survey. Nutrition [Internet]. 2016; 32(2):255-259. DOI: https://doi.org/10.1016/j.nut.2015.08.019
        16. 16. Ramírez-Vélez R, Correa-Bautista JE, Martínez-Torres J, Meneses-Echávez JF, Lobelo F. Vitamin B12 concentrations in pregnant Colombian women: analysis of nationwide data 2010. BMC Pregnancy Childbirth [Internet]. 2016; 16(1):26. DOI: https://doi.org/10.1186/s12884-016-0820-4
        17. 17. Gaviria A, Hoyos A. Anemia and child education: The case of Colombia. Desarro Soc [Internet]. 2011; (68):47-77. DOI: https://doi.org/10.13043/dys.68.2
        18. 18. Suarez-Ortegón MF, Ordoñez-Betancourth JE, Ortega-Ávila JG, Forero AY, Fernández-Real JM. Excess adiposity and iron-deficient status in Colombian women of reproductive age. Obesity [Internet]. 2023; 31(12):3025-3042. DOI: https://doi.org/10.1002/oby.23871
        19. 19. Rincón-Pabón D, González-Santamaría J, Urazán-Hernández Y. Prevalencia y factores sociodemográficos asociados a anemia ferropénica en mujeres gestantes de Colombia (análisis secundario de la ENSIN 2010). Nutr Hosp [Internet]. 2019; 36(1):87-95. DOI: https://doi.org/10.20960/nh.1895
        20. 20. Ramírez-Vélez R, Izquierdo M, López-Gil JF, Rincón-Pabón D, Martínez-Jamioy EN, Rivera-Ruiz R, et al. Prevalence of meeting all three 24-h movement guidelines and its correlates among preschool-aged children. Scand J Med Sci Sports [Internet]. 2023; 33(6):979-988. DOI: https://doi.org/10.1111/sms.14320
        21. 21. Poveda-Acelas CA, Poveda-Acelas DC. Relación entre actividad física, sedentarismo y exceso de peso en adolescentes de los Santanderes, Colombia. Salud UIS [Internet]. 2021; 53:e21024. DOI: https://doi.org/10.18273/saluduis.53.e:21024
        22. 22. Gómez LF, Lucumí DI, Parra DC, Lobelo F. Niveles de Urbanización, Uso de Televisión y Video-juegos en Niños Colombianos: Posibles Implicaciones en Salud Pública. Rev Salud Publica [Internet]. 2008; 10(4):505-516. DOI: https://doi.org/10.1590/s0124-00642008000400001
        23. 23. Gómez LF, Parra DC, Lobelo F, Samper B, Moreno J, Jacoby E, et al. Television viewing and its association with overweight in Colombian children: results from the 2005 National Nutrition Survey: a cross-sectional study. Int J Behav Nutr Phys Act [Internet]. 2007; 4(1):41. DOI: https://doi.org/10.1186/1479-5868-4-41
        24. 24. Rincón-Pabón D, Urazán-Hernández Y, González-Santamaría J. Association between the time spent watching television and the sociodemographic characteristics with the presence of overweight and obesity in Colombian adolescents (secondary analysis of the ENSIN 2010). PLoS One [Internet]. 2019; 14(5):e0216455. DOI: https://doi.org/10.1371/journal.pone.0216455
        25. 25. Sansón-Rosas AM, Bernal-Rivas J, Kubow S, Suarez-Molina A, Melgar-Quiñonez H. Food insecurity and the double burden of malnutrition in Colombian rural households. Public Health Nutr [Internet]. 2021; 24(14):4417-4429. DOI: https://doi.org/10.1017/s1368980021002895
        26. 26. Bermúdez JN, Ayala D, Herrán OF. Nutrition gap in children, urban-rural: the key role of education and food. Colombia, 2015. Rev Saude Publica [Internet]. 2020; 54:111. DOI: https://doi.org/10.11606/s1518-8787.2020054001925
        27. 27. Camargo MI, Quintero DC, Herrán OF. Seguridad Alimentaria en Colobmia y modelo Rasch. Rev Chil Nutr [Internet]. 2012; 39(2):168-179. DOI: https://doi.org/10.4067/S0717-75182012000200006
        28. 28. González-Zapata LI, Restrepo-Mesa SL, Mancilla-López L, Sepúlveda-Herrera D, Estrada-Restrepo A. Inequalities in food consumption among Colombian households: results from the National Survey of Nutritional Status. Hacia Promoc Salud [Internet]. 2021; 26(1):98-117. DOI: https://doi.org/10.17151/hpsal.2021.26.1.9
        29. 29. Herrán OF, Patiño GA, Zea MP. Patrones de consumo alimentario y pobreza monetaria en Colombia. Rev Chil Nutr [Internet]. 2018; 45(4):372-380. DOI: https://doi.org/10.4067/s0717-75182018000500372
        30. 30. Sánchez-Céspedes LM, Suárez-Higuera EL, Soto-Rojas VE, Rosas-Vargas LJ, del Castillo-Matamoros SE. Gender differences in the use of coping strategies to reduce food insecurity in Colombia. Cad Saude Publica [Internet]. 2022; 38(8):e00146821. DOI: https://doi.org/10.1590/0102-311xen252121
        31. 31. Pérez-Tamayo EM, Alfonso-Mora MS, Poveda NE, Leyva-Sánchez AS. Association of all forms of malnutrition and socioeconomic status, educational level and ethnicity in Colombian children and non-pregnant women: National Nutrition Survey (ENSIN) 2015. Nutrients [Internet]. 2020; 12(3):682.
        32. 32. Castillo AN, Suarez-Ortegón MF. Dual burden of individual malnutrition in children 1-4 years: Findings from the Colombian Nutritional Health Survey ENSIN 2015. Pediatr Obes [Internet]. 2023; 18(6):e13020. DOI: https://doi.org/10.1111/ijpo.130208
        33. 33. Meisel JD, Ramírez AM, Esguerra V, Montes F, Stankov I, Sarmiento OL, et al. Using a system dynamics model to study the obesity transition by socioeconomic status in Colombia at the country, regional and department levels. BMJ Open [Internet]. 2020; 10(6):e036534. DOI: https://doi.org/10.1136/bmjopen-2019-036534
        34. 34. Sánchez Monroy CC. Sobrepeso y obesidad en adultos: aportes de un análisis geoespacial. Rev Fac Nac Salud Pública [Internet]. 2023; 41(2):e351984. DOI: https://doi.org/10.17533/udea.rfnsp.e351984
        35. 35. Forero Torres AY, Forero LC. Comparación entre mediciones e índices antropométricos para evaluar la obesidad general y la abdominal, Colombia ENSIN 2015. Biomédica [Internet]. 2023; 43(Suppl 3):88-98. DOI: https://doi.org/10.7705/biomedica.7011
        36. 36. Aldana-Parra F, Vega GO, Fewtrell M. Associations between maternal BMI, breastfeeding practices and infant anthropometric status in Colombia: secondary analysis of ENSIN 2010. BMC Public Health [Internet]. 2020; 20(1):232. DOI: https://doi.org/10.1186/s12889-020-8310-z
        37. 37. Castro-Prieto PA, Spijker J, Recaño J. A quasi-cohort trend analysis of adult obesity in Colombia. J Biosoc Sci [Internet]. 2023; 56(1):63-89. DOI: https://doi.org/10.1017/S002193202300010X
        38. 38. Mora-García G, Trujillo A, García-Larsen V. Diet quality, general health and anthropometric outcomes in a Latin American population: evidence from the Colombian National Nutritional Survey (ENSIN) 2010. Public Health Nutr [Internet]. 2020; 24(6):1385-1392. DOI: https://doi.org/10.1017/s1368980019005093
        39. 39. Osorio-Mejía AM, Martínez-Arbeláez S, Ramírez-Girón N. Determinantes socioeconómicos del exceso de peso en niños preescolares y escolares colombianos. Encuesta Nacional de Situación Nutricional 2015. Arch Latinoam Nutr [Internet]. 2022; 72(4):243-252. DOI: https://doi.org/10.37527/2022.72.4.002
        40. 40. Mendoza-Romero D, Urbina A, Cristancho-Montenegro A, Rombaldi A. Impact of smoking and physical inactivity on self-rated health in women in Colombia. Prev Med Rep [Internet]. 2019; 16:100976. DOI: https://doi.org/10.1016/j.pmedr.2019.100976
        41. 41. López-Gil JF, Izquierdo M, García-Hermoso A, Alonso-Martínez AM, Rincón-Pabón D, Morales-Osorio MA, Ramírez-Vélez R. Factors associated with meeting the WHO physical activity recommendations in pregnant Colombian women. Sci Rep [Internet]. 2022;12:19500. DOI: https://doi.org/10.1038/s41598-022-23947-7
        42. 42. Fothergill A, Fonesca Centeno ZY, Ocampo Téllez PR, Pachón H. Consumption of fortified wheat flour and associations with anemia and low serum ferritin in Colombia. Perspect Nutr Hum [Internet]. 2019; 21(2):159-171. DOI: https://doi.org/10.17533/udea.penh.v21n2a03
        43. 43. Gaitán DA, Estrada A, Lozano GA, Manjarrés LM. Alimentos fuentes de sodio: análisis basado en una encuesta nacional en Colombia. Nutr Hosp [Internet]. 2015; 32(5):2338-2345. Disponible en: https://scielo.isciii.es/scielo.php?script=sci_arttext&pid=S0212-16112015001100058&lng=en
        44. 44. Herrán OF, Gamboa-Delgado EM. Trends of adherence to dietary patterns in Colombian population, 2010-2015. Am J Health Behav [Internet]. 2020; 44(5):704-718. DOI: https://doi.org/10.5993/AJHB.44.5.13
        45. 45. Instituto Nacional de Salud Pública. Encuesta Nacional de Salud y Nutrición 2012. Resultados nacionales. Cuernavaca (MEX): Instituto Nacional de Salud Pública; 2012. Disponible en: https://www.insp.mx/produccion-editorial/publicaciones-anteriores-2010/3004-encuesta-nacional-de-salud-y-nutricion-2012-resultados-nacionales-2da-edicion.html
        46. 46. Buriti de Sousa L, Marques de Oliveira MR, de Paula Santos LM, Cabrera-Arana GA, Louzada MLC, Jaime PC. Obesidad en las políticas públicas de países de América Latina: Argentina, Brasil, Colombia, Chile y Ecuador. Ciênc saúde coletiva. 2020;25(11):4411-4422.
        47. 47. Ramírez-Vélez R, González-Ruíz K, Correa-Bautista JE, Martínez-Torres J, Meneses-Echávez JF, Rincón-Pabón D. Ferritin levels in pregnant Colombian women. Nutr Hosp [Internet]. 2015; 31(2):793-797. DOI: https://doi.org/10.3305/nh.2015.31.2.7910
        48. 48. Martínez-Torres J, Meneses-Echávez JF, Correa-Bautista JE, Ramírez-Vélez R. Soft drinks consumption among pregnant women in Colombia: Factors associated. Nutr Hosp [Internet]. 2015; 32(2):855-862. Disponible en: https://europepmc.org/article/MED/26268121
        49. 49. Zea MP, Herrán OF. Meal Pattern in the Colombian Population: Results of the National Nutrition Survey. ENSIN, 2015. J Nutr Metab. 2022;2022:9209590. doi: https://doi.org/10.1155/2022/9209590.
        50. 50. Martínez-Torres J, Meneses-Echávez JF, Ramírez-Vélez R. Prevalence and demographic factors associated with vitamin A deficiency in Colombian children aged 12-59 months. Endocrinol Nutr [Internet]. 2014; 61(9):460-466. DOI: https://doi.org/10.1016/j.endoen.2014.03.015
        51. 51. Herrán OF, Patiño GA, Gamboa-Delgado EM. Socioeconomic inequalities in the consumption of fruits and vegetables: Colombian National Nutrition Survey, 2010. Cad Saude Publica [Internet]. 2019; 35(2):e00027818. DOI: https://doi.org/10.1590/0102-311x00031418
        52. 52. Vélez-Cuellar NN, Toloza-Pérez YG, Malagón-Rojas J. Prevención de la osteoporosis en población mayor de 50 años en Colombia: Un modelo de intervención desde la perspectiva nutrieconómica. Salud UIS [Internet]. 2023; 55(1):e23071. DOI: https://doi.org/10.18273/saluduis.55.e:23071
        53. 53. Herrán OF, Bermúdez JN, Zea MP. Cambios alimentarios en Colombia: resultados de dos encuestas nacionales de nutrición, 2010-2015. Salud UIS [Internet]. 2020; 52(1):21-31. DOI: https://doi.org/10.18273/revsal.v52n1-2020004
        54. 54. Herrán OF, Zea MP. Intake of animal protein and dietary sources in the Colombian population: Results of the National Nutrition Survey (ENSIN-2015). J Nutr Metab [Internet]. 2022; 2022(1):2345400. DOI: https://doi.org/10.1155/2022/2345400
        55. 55. Ramírez-Vélez R, González-Ruíz K, Correa-Bautista JE, Meneses-Echávez JF, Martínez-Torres J. Diferencias demográficas y socioeconómicas asociadas al consumo de bebidas azucaradas en niños y adolescentes colombianos. Nutr Hosp [Internet]. 2015;31(6):2479-2486. DOI: https://doi.org/10.3305/nh.2015.31.6.8986
        56. 56. Martínez-Torres J, Ramírez-Vélez R. Zinc deficiency and associated factors in Colombian children: results from the 2010 National Nutrition Survey; a cross sectional study. Nutr Hosp [Internet]. 2014; 29(4):832-837. DOI: https://doi.org/10.3305/nh.2014.29.4.7226
        57. 57. Ramírez-Vélez R, Correa-Bautista JE, Martínez-Torres J, González-Ruíz K, Lobelo F. Ferritin levels in Colombian children: findings from the 2010 National Nutrition Survey (ENSIN). Int J Environ Res Public Health [Internet]. 2016; 13(4):405. DOI: https://doi.org/10.3390/ijerph13040405
        58. 58. Ramírez-Vélez R, Correa-Bautista JE, Martínez-Torres J, Meneses-Echávez JF, González-Ruiz K, González-Jiménez E, et al. LMS tables for waist circumference and waist-height ratio in Colombian adults: analysis of nationwide data 2010. Eur J Clin Nutr [Internet]. 2016; 70(10):1189-1196. DOI: https://doi.org/10.1038/ejcn.2016.46
        59. 59. Benjumea-Rincón MV, Parra-Sánchez JH, Ocampo-Téllez PR. Concordancia en la talla para la edad entre referencias NCHS y OMS en indígenas colombianos. Rev Salud Publica [Internet]. 2016; 18(4):503-515. DOI: https://doi.org/10.15446/rsap.v18n4.47644
        60. 60. Ramírez-Vélez R, Correa-Bautista JE, Triana-Reina HR, González-Jiménez E, Schmidt-RioValle J, González-Ruíz K. Use of dietary supplements by pregnant women in Colombia. BMC Pregnancy Childbirth [Internet]. 2018; 18:117. DOI: https://doi.org/10.1186/s12884-018-1758-5
        61. 61. Instituto Nacional de Salud Pública de México. Encuesta Nacional de Salud y Nutrición - Medio Camino 2016 [Internet]. Cuernavaca (MEX); [citado 2023 Ago 25]. Disponible en:https://ensanut.insp.mx/encuestas/ensanut2016/index.php
        62. 62. Ministerio de Salud de la Nación. ENNyS: Encuesta Nacional de Nutrición y Salud: documento de resultados. Buenos Aires (ARG); 2007. Disponible en: https://cesni-biblioteca.org/archivos/ennys.pdf
        63. 63. Secretaría de Gobierno de Salud de Argentina, Ministerio de Salud y Desarrollo Social. Segunda Encuesta Nacional de Nutrición y Salud ENNyS 2: Resumen ejecutivo. Buenos Aires (ARG); 2019. Disponible en: https://cesni-biblioteca.org/2-encuesta-nacional-de-nutricion-y-salud-ennys-2-resumen-ejecutivo
        64. 64. Instituto Nacional de Estadística de España, Ministerio de Sanidad. Encuesta Nacional de Salud 2006: Metodología detallada. Madrid (ESP): Ministerio de Sanidad, Servicios Sociales e Igualdad; 2007. Disponible en: https://www.sanidad.gob.es/estadEstudios/estadisticas/encuestaNacional/encuestaNac2006/metodENS2006.pdf
        65. 65. Instituto Nacional de Estadística de España, Ministerio de Sanidad de España. Encuesta Nacional de Salud de España 2011/12. Madrid (ESP): Ministerio de Sanidad, Servicios Sociales e Igualdad; 2013. Disponible en: https://www.sanidad.gob.es/estadEstudios/estadisticas/encuestaNacional/encuesta2011.htm
        66. 66. Public Health England. National Diet and Nutrition Survey: Results from Years 1 to 9 (2008/09-2016/17) [Internet]. London (GBR): Public Health England; 2019.